
|
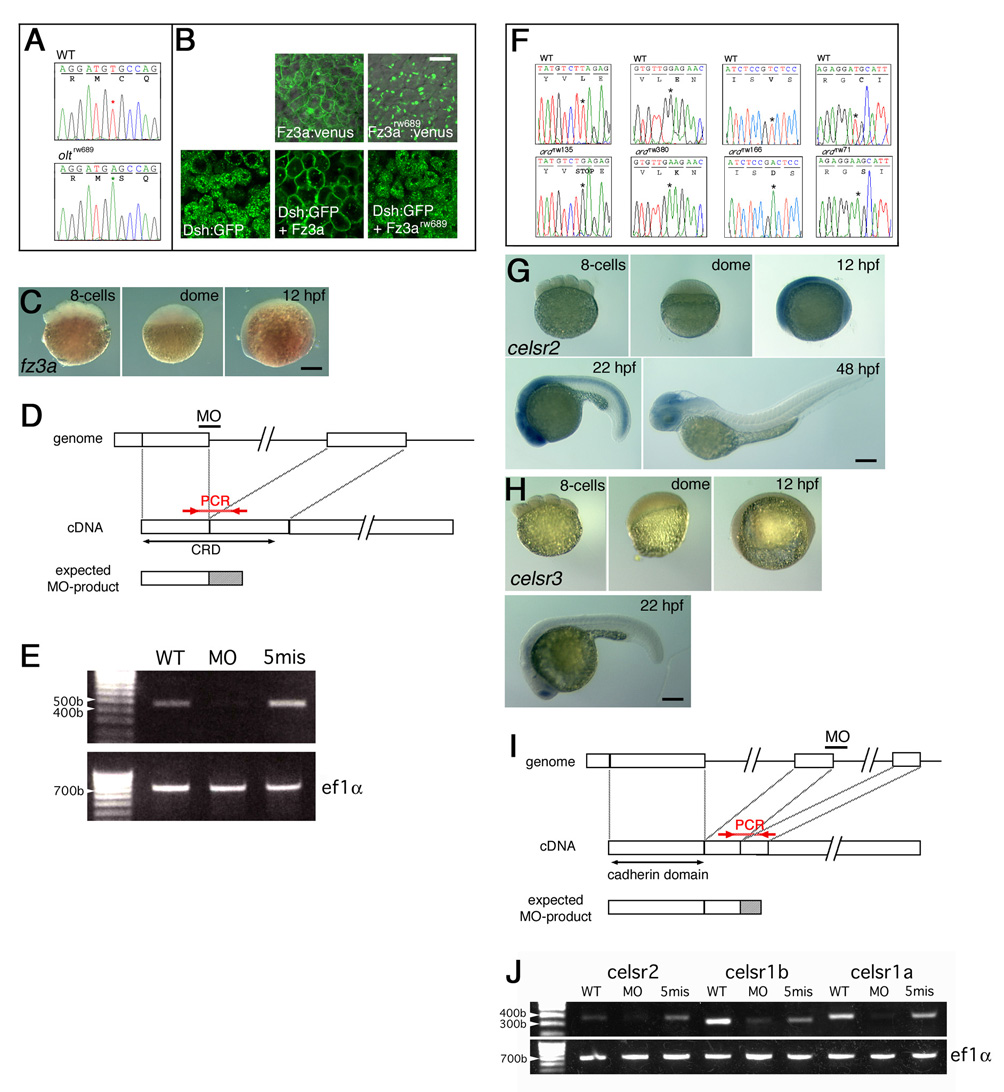
Fig. S2 Analyses of the fz3a and celsr genes. (A) Comparison of DNA-sequencing output for the region of the olt mutation and the same region on the wild-type allele. (B) Subcellular localization of Fz3a-Venus and Xdsh-GFP proteins at the blastula stages. Fz3a-Venus, but not Fz3arw689-Venus, was associated with the plasma membrane. Overexpressed Xdsh-GFP localized in the cytoplasmic regions. Co-injection with the fz3a mRNA, but not the mutated fz3arw689 mRNA, resulted in recruitment of Xdsh-GFP to the plasma membrane. Scale bar: 20 μm. (C) Lateral views of wild-type embryos reacted with the fz3a RNA probe at the indicated embryonic stages. fz3a mRNA was slightly expressed in the brain at 12 hpf. (D) The position of fz3a-MO was designed to disrupt the splicing of the first intron of the fz3a transcript, giving rise to a protein containing the truncated CRD with 19 irrelevant amino acids. (E) RT-PCR analyses were performed as described (Goutel et al., 2000). The analyses showed a significant reduction of the normal fz3a mRNA in the fz3a-MO injected embryos. The primers used to detect the mRNA (positions are indicated in D) were shown in Table1. Control primers were used to amplify the ef1a gene (Goutel et al., 2000). (F) Comparison of DNA sequencing output for the regions of the ord mutations and the same regions on the wild-type allele. (G-H) Expression patterns of celsr2 (G) and celsr3 (E) genes at the indicated embryonic stages. celsr2 was detected throughout the embryo in the gastrula stages and became restricted to the CNS region thereafter. celsr3 mRNA was barely expressed in the hindbrain. Lateral views of the embryos are shown. (I) The positions of celsr1a-MO, celsr1b-MO and celsr2-MO were designed to disrupt the second intron of each gene transcript, giving rise to truncated proteins containing the cadherin repeats domain with 39 irrelevant amino acids (celsr2-MO) or 17 irrelevant amino acids (celsr1a-MO and celsr1b-MO). (E) RT-PCR analyses showed significant reductions in the normal celsr mRNA in embryos injected with each MO. The primers used to detect mRNA (positions are indicated in I) were shown in Table1. Scale bars: 50 μm.