
|
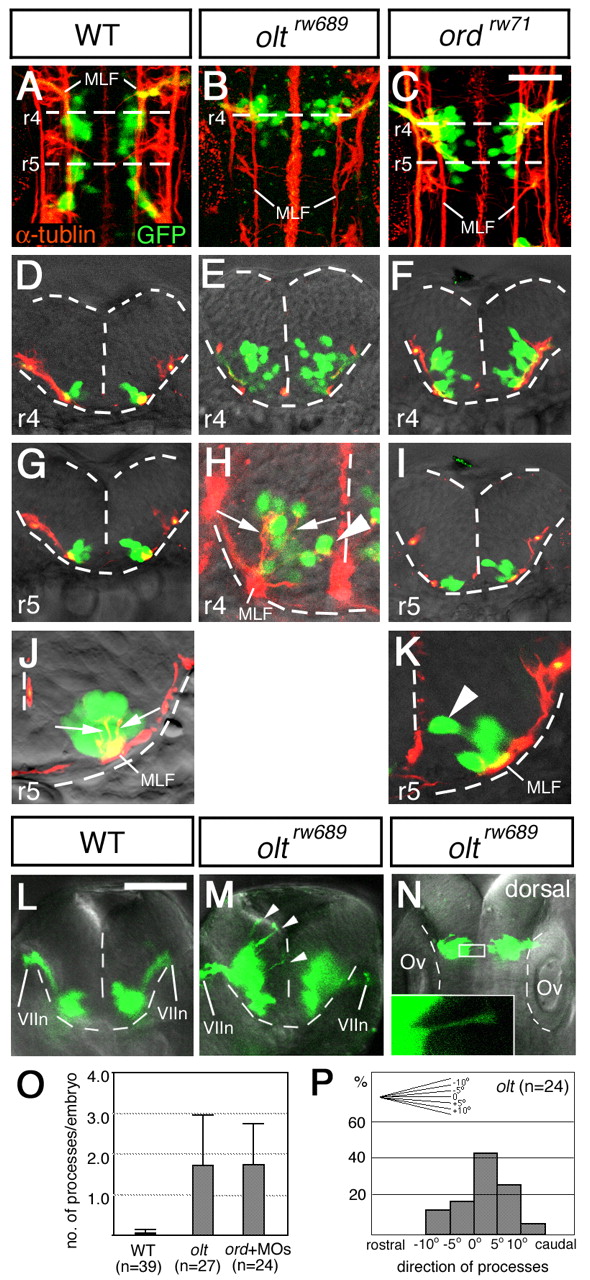
Fig. 4 Defective migration of the nVII motor neurons in mutant embryos. (A-K) Wild-type (A,D,G,J), oltrw689 (B,E,H) and ordrw71 (C,F,I,K) Isl1-GFP embryos were stained with anti-acetylated α-tubulin antibody. (A-C) Composite stacks of serial optical sections, shown in dorsal view. (D-K) Images are single focal planes of cross sections at the rhombomeric regions indicated by broken lines in A-C. Hindbrain regions are outlined by broken lines. (H,J,K) Higher magnifications of E, G, I, respectively. In the mutant embryos, some of the neurons reach the ventricular surface (arrowheads in H and K). However, these mismigrated neurons extend axons normally (shown by arrows in H and J). GFP-expression in single axons was barely detectable (H). Therefore, the yellow signals of the axons of the nVII motor neurons in the wild-type embryos (J) are technical artifacts caused by superimposition of the red signals of the axons and the green signals of the cell bodies of the overlapping neurons. (L-P) Aberrant radial processes in the mutant embryos (arrowheads in M). Frontal views of the live wild-type (L) and olt (M) Isl1-GFP embryos at r4, and a dorsal view of the olt Isl1-GFP embryo (N) at 24 hpf. Higher magnification of the boxed region is shown in the inset. (L-N) Images are composite stacks of serial optical sections. (O) Scoring of aberrant processes in the wild-type (WT), olt and ord embryos injected with celsr1a/1b-MOs (ord+MOs). Bars represent S.D. (P) Direction of the aberrant processes was quantified in the olt embryos. The angle of each process was measured as the deviation from the right angle to the midline. Scale bars: 50 μm.