
|
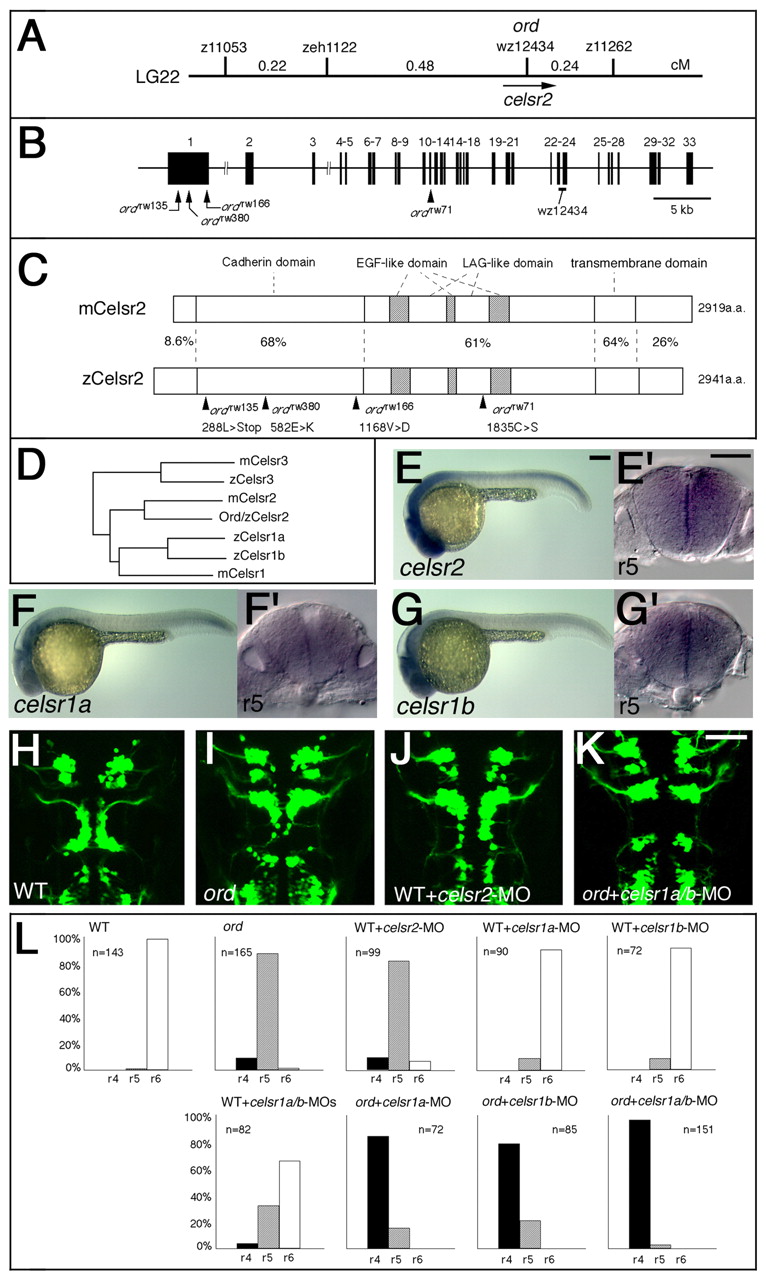
Fig. 3 Identification of the ord gene as zebrafish celsr2 gene. (A) Genetic map of the ord locus. (B) Genomic structure of the zebrafish celsr2 gene. The nucleotide substitution resulting from each mutation is indicated. (C) Schematic drawings of the mouse and zebrafish Celsr2 proteins. Amino acid sequence similarity (%) is shown for each domain. The amino acid substitution resulting from each mutation is indicated. (D) The phylogenetic tree for celsrfamily genes. (E-G) Lateral views of wild-type embryos reacted with RNA probes for celsr2 (E), celsr1a (F) and celsr1b (G) at 24 hpf. (E',F',G') Cross sections at r5 for each embryo, E-G, respectively. (H-K) A wild-type Isl1-GFP embryo injected with celsr2-MO (J) shows incomplete disruption of the neuronal migration as observed in an ord embryo (I). (K) An ord mutant embryo injected with celsr1a/1b-MOs shows complete loss of migration of the nVII motor neurons. The embryos are shown in dorsal view and the images are composite stacks of serial optical sections. (L) The neuronal migration phenotype in each experiment was scored as follows: r4, complete loss of migration, as shown in K; r5, partial disruption of migration, as shown in I; and r6, normal migration, as shown in H. Scale bars: 50 μm.