
|
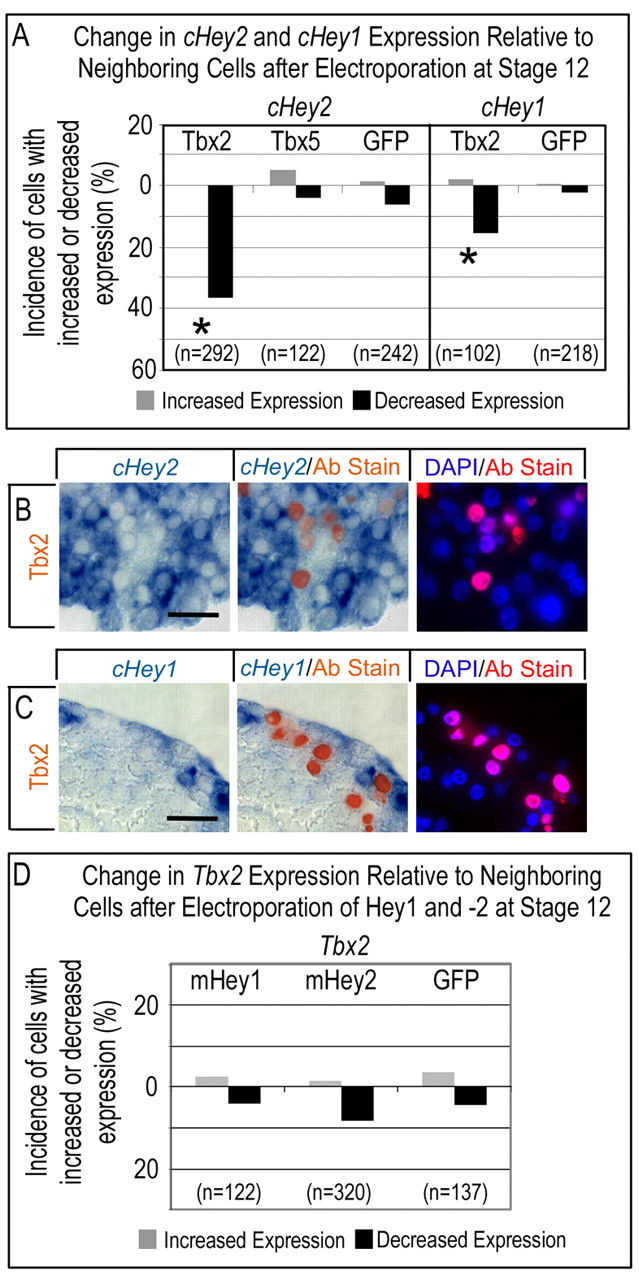
Fig. 7 Tbx2 represses Hey1 and Hey2 cell autonomously. (A) Misexpression of Myc-tagged Tbx2 in stage 12 hearts caused a cell-autonomous reduction in the incidence of Hey1- and Hey2-positive cells. Tbx5, by contrast, had no effect. Asterisks indicate statistical significance of the difference between electroporated Tbx2 and the GFP control (P<0.05, χ2 test). (B,C) Histological sections demonstrating the cell-autonomous suppression of endogenous Hey1 (B) and Hey2 (C) by electroporated Tbx2. (D) Flag-tagged mouse Hey1 and mouse Hey2 did not alter Tbx2 expression. Brightfield, merged and fluorescent images are as in Fig. 3. Scale bar: 50 μm.