
|
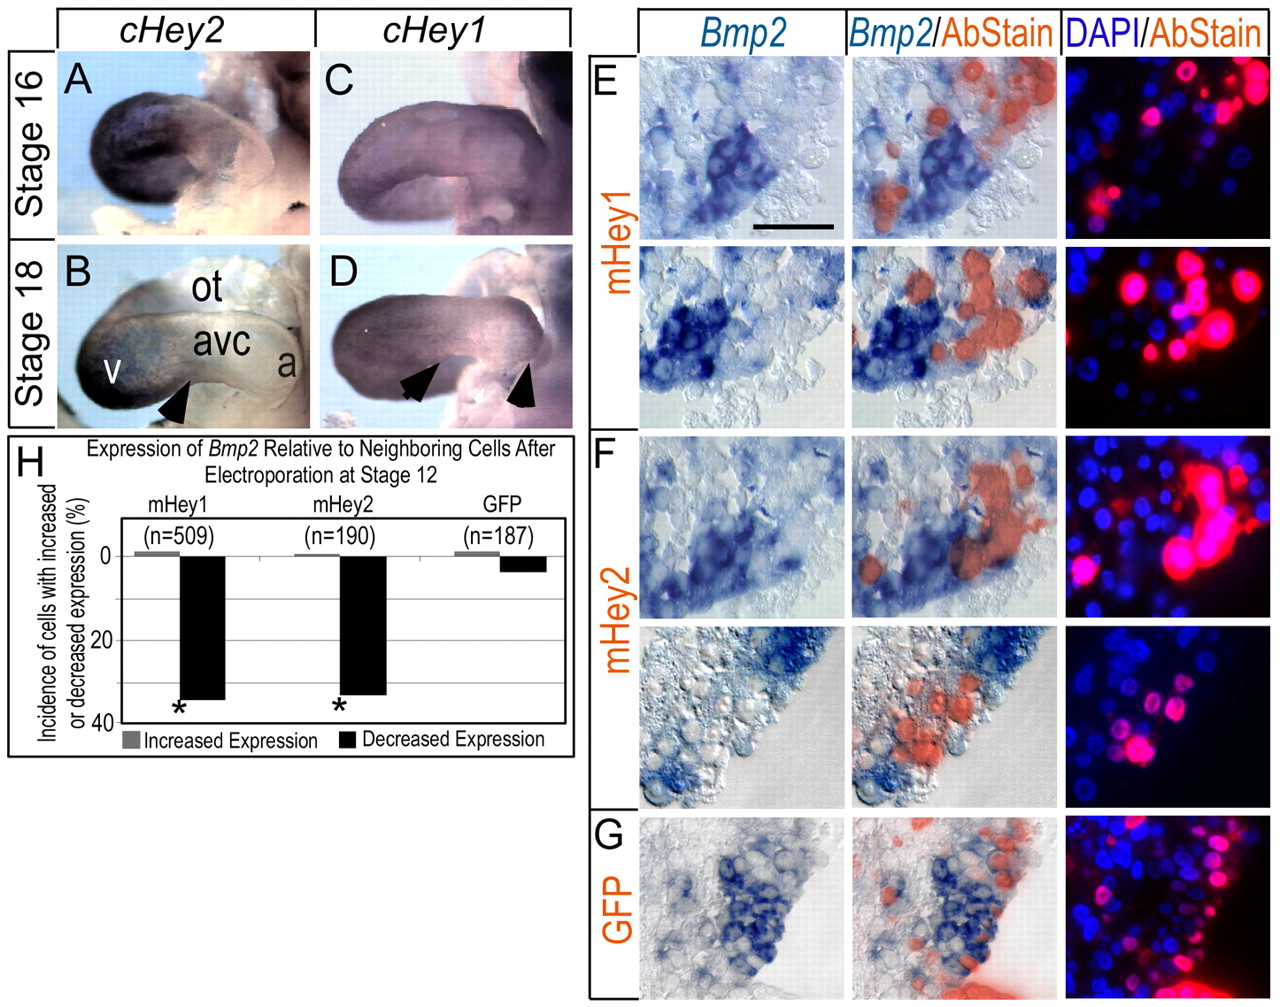
Fig. 4 Ectopic Hey1 and Hey2 suppress Bmp2 cell autonomously in the AVC and IC. (A-D) Examples of endogenous Hey2 and Hey1 mRNA expression in stage 16 and 18 embryos. Arrowheads denote the borders of mRNA expression. (A,B) Hey2 expression is restricted to the developing ventricles at all stages examined, similar to patterns reported for the mouse. (C) Low levels of Hey1 are detected throughout the myocardium of stage 16 chick hearts. (D) By stage 18, Hey1 is detected in atrial and ventricular myocardium, but not AVC, as for expression of Serrate1 (see Fig. 1). Arrowheads indicate the borders of Hey gene expression with the AVC. (E-G) Bmp2 suppression by exogenously provided Myc-tagged mouse Hey1 and Flag-tagged mouse Hey2. Immunohistochemical staining (red fluorescence) detected epitopes on expressed proteins from the electroporated cDNAs, as in Fig. 3: Hey1 (E), Hey2 (F) or GFP control (G). Scale bar in E: 50 μM. (H) Quantification was performed as for Fig. 3. Asterisk indicates statistical significance of a difference between the effect of Hey proteins and GFP control (P<0.05, χ2 test).