
|
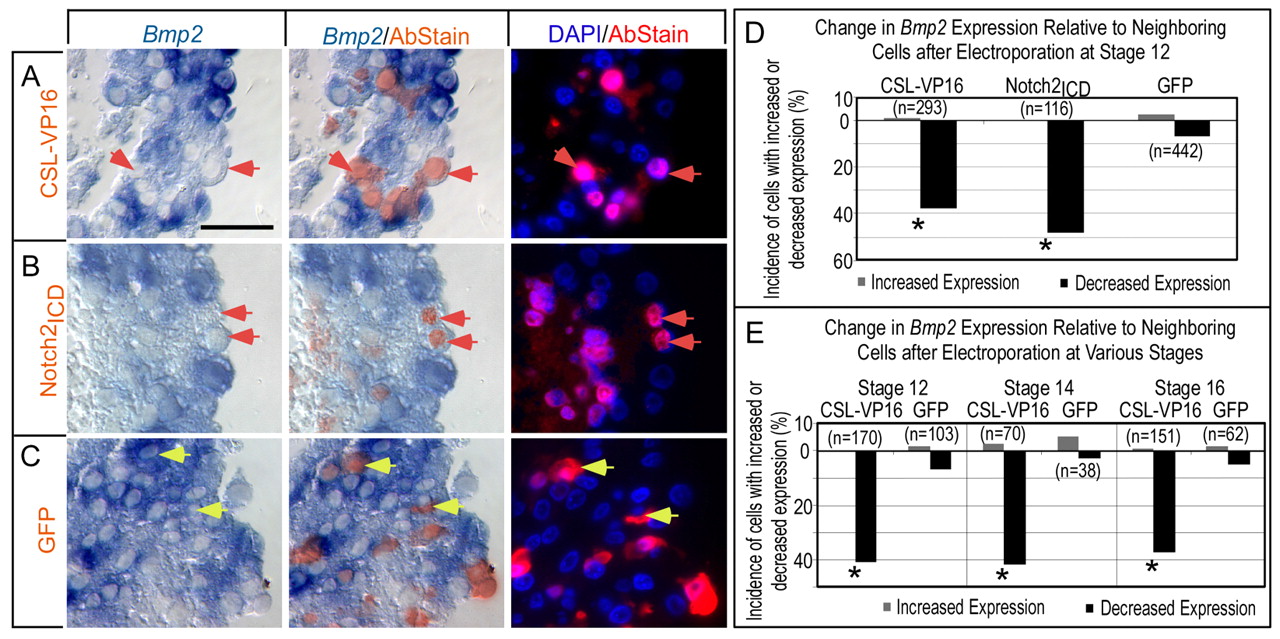
Fig. 3 Notch pathway agonists inhibit Bmp2 expression cell autonomously in the AVC and IC. (A-C) Histological sections demonstrating that misactivation of Notch signaling suppresses Bmp2. Immunohistochemical staining (red fluorescence) detected epitopes on expressed proteins from the electroporated cDNAs: CSL-VP16 (A), Notch2ICD (B) or GFP control (C). Brightfield images on the left show in situ hybridization (blue). Cy3 (red) and DAPI (blue) fluorescent images are shown on right. The center panels show brightfield images merged with the fluorescent Cy3 (red) staining of the epitope-tagged proteins. Red arrows indicate examples of cells with reduced Bmp2 relative to neighbors, whereas yellow arrows indicate examples of unchanged cells. Scale bar in A: 50 μM. (D,E) Quantification of cells scored for altered gene expression relative to neighboring cells after electroporation with the indicated cDNAs, scored from histological sections as in A-C. All sample identifiers were encoded prior to histological embedding so that tissue processing and scoring was performed blind (see Materials and methods). Data plotted are cumulative over greater than three trials. Note that Notch pathway activation suppresses Bmp2 expression (D) and that Bmp2 remains responsive throughout the period of heart looping (HH stages 12-16; E). Asterisks indicate statistical significance of the difference between the experimental modulation of Notch pathway and the control GFP (P<0.05, χ2 test).