
|
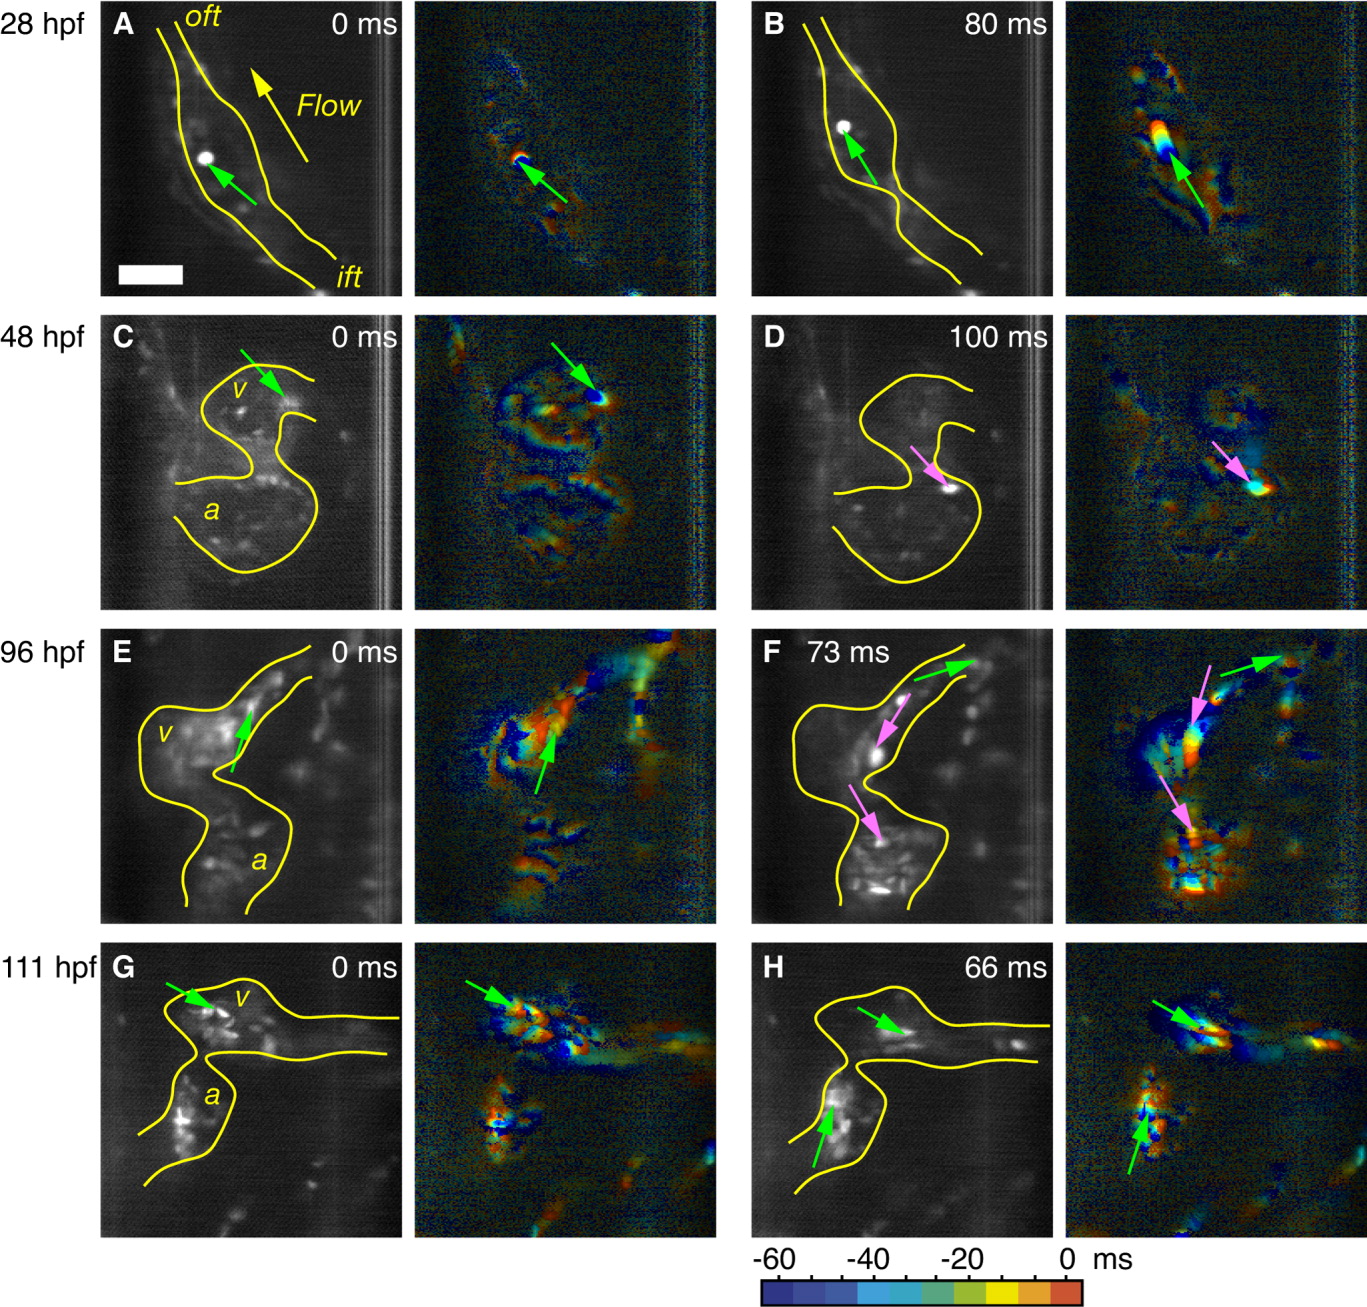
Fig. 3 Dynamic slice sequence (sections) of the developing Tg(gata1:GFP) zebrafish heart. A-H: Grayscale images correspond to still frames, color images were obtained by superimposing 10 frames of the image sequence. Each color corresponds to one time point. The first frame is assigned blue, the last frame, which corresponds to the still frame, red. A,C,E,G: Beginning of ventricle contraction. The flow is in the forward direction as can be seen from the direction of the blue to red streaks left by the red blood cells (indicated by green arrows). B,F: At a later time-point in the cardiac cycle, the flow is still uniquely forward at 28 hours postfertilization (hpf) and 111 hpf. D,H: At 48 hpf and 96 hpf, retrograde flow is visible, exhibited by the streaks in backward direction (indicated by pink arrows). Scale bar = 50 μm. a, atrium; v, ventricle; ift, inflow tract; oft, outflow tract.