
Image
|
Figure Caption
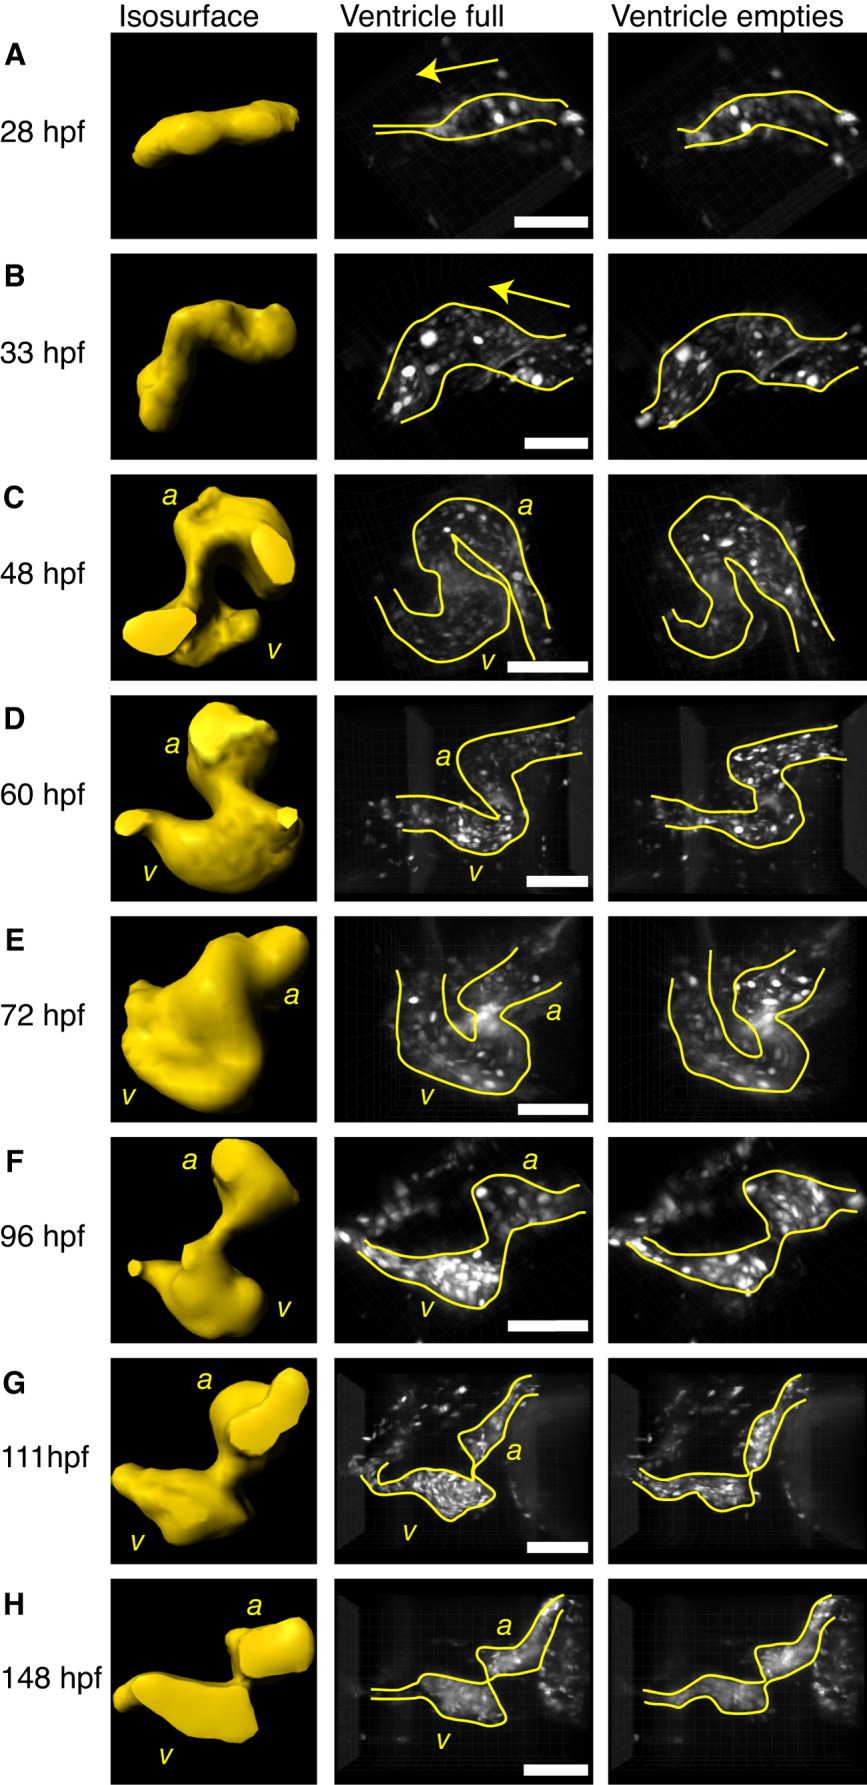
Fig. 2 Dynamic three-dimensional (3D) reconstruction of the developing Tg(gata1:GFP) zebrafish heart at various stages. Left column corresponds to isosurface renderings obtained during mid-diastole. Central column: 3D volume renderings (maximum intensity projection) when the ventricle is full. Right column: 3D volume renderings when the ventricle empties. a, atrium; v, ventricle. Arrows indicate flow direction. Scale bars = 100 μm.
Acknowledgments
This image is the copyrighted work of the attributed author or publisher, and
ZFIN has permission only to display this image to its users.
Additional permissions should be obtained from the applicable author or publisher of the image.
Full text @ Dev. Dyn.