
|
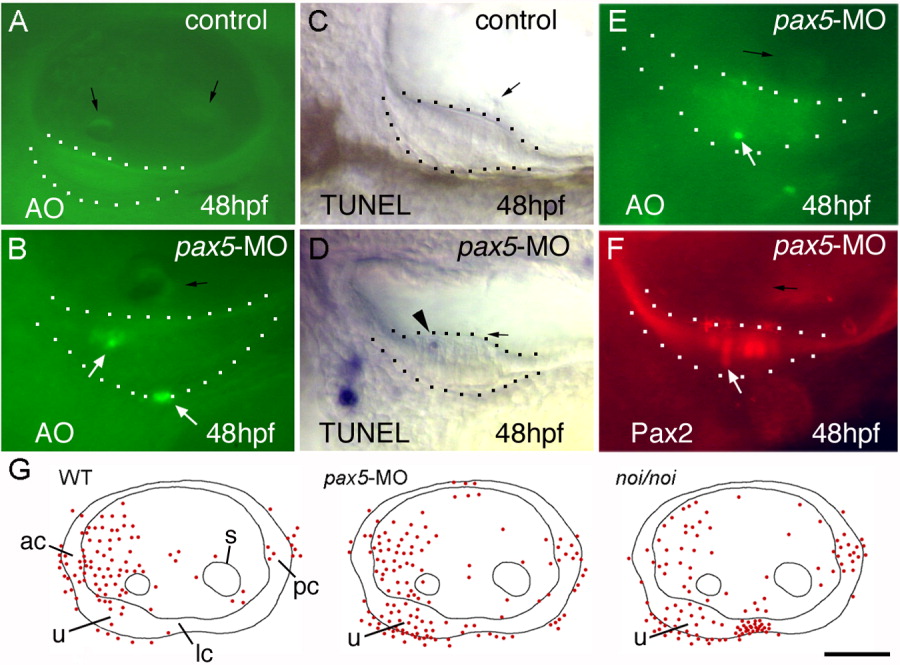
Fig. 6 Analysis of cell death in pax5 morphants. A,B: Acridine orange (AO) staining in the otic vesicle of a control embryo (A) and in the utricle of a pax5 morphant (B) at 48 hours postfertilization (hpf). White arrows indicate AO-positive cells, black arrows show otoliths. C,D: Terminal deoxynucleotidyl transferase-mediated deoxyuridinetriphosphate nick end-labeling (TUNEL) staining in the utricle of a control embryo (C) and a pax5 morphant (D) at 48 hpf. E: The arrowhead shows a TUNEL-positive cell. E,F: A pax5-morphant stained with acridine orange at 48 hpf (E) and subsequently stained with anti-Pax2 (F). An AO-positive cell appears in the same position as a misplaced hair cell (white arrows). The utricular macula is outlined in A-F. G: Cumulative data (n = 30) representing the frequency and distribution of AO-labeled cells in the otic vesicle of a wild-type control embryo, a pax5 morphant, and a noi/noi mutant at 48 hpf. The positions of labeled cells (red spots) were projected onto schematic maps of the otic vesicle. Positions of the utricular macula (u), saccular macula (s), anterior crista (ac), lateral crista (lc), and posterior crista (pc) are indicated. All images show lateral views, with anterior to the left. Scale bar = 40 μm in A, 25 μm in B-D, 30 μm in E,F, 50 μm in G.