
|
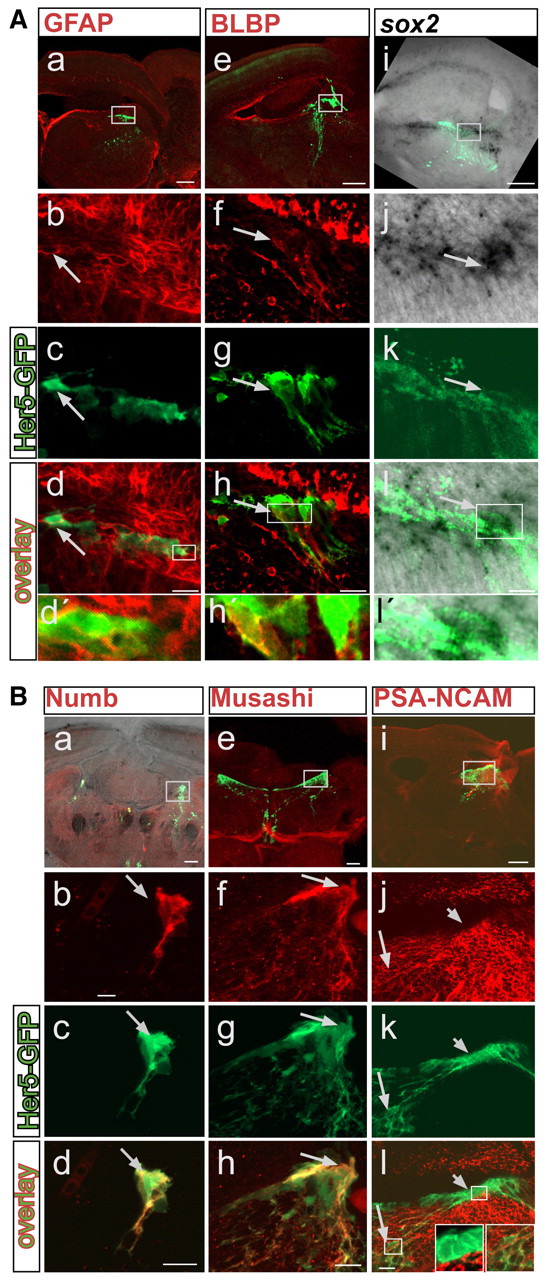
Fig. 4 Her5-GFP-positive cells lining the tectal ventricle express stem cell markers. (A) Co-localization of Her5-GFP (green) with GFAP (a-d'), BLBP (e-h'), sox2 (i-l'). (B) Co-localization of Her5-GFP (green) with Numb (a-d), Musashi (e-h) and PSA-NCAM (i-l). Sagittal (GFAP, BLBP, sox2, PSA-NCAM) or cross-sections (Numb and Musashi) are shown. sox2 is detected by in situ hybridization (black signal), while all other markers are detected by immunohistochemistry (red signal). (A, parts i-l'; B, part a) An overlay with the brightfield view in addition to fluorescence. All long arrows point to cells that co-express Her5-GFP and the respective markers. (B, parts j-l) Her5-GFP-positive cells located close to the ventricle, which also express her5 RNA (Fig. 1C,E), are PSA-NCAM-negative (short arrow, left inset) while Her5-GFP-positive cells located further ventrally do express PSA-NCAM (long arrow, right inset), indicating their differentiation into a neuronal fate. Scale bars: 100 μm in a,e,i; 10 μm in b-d,f-h,j-l.