
|
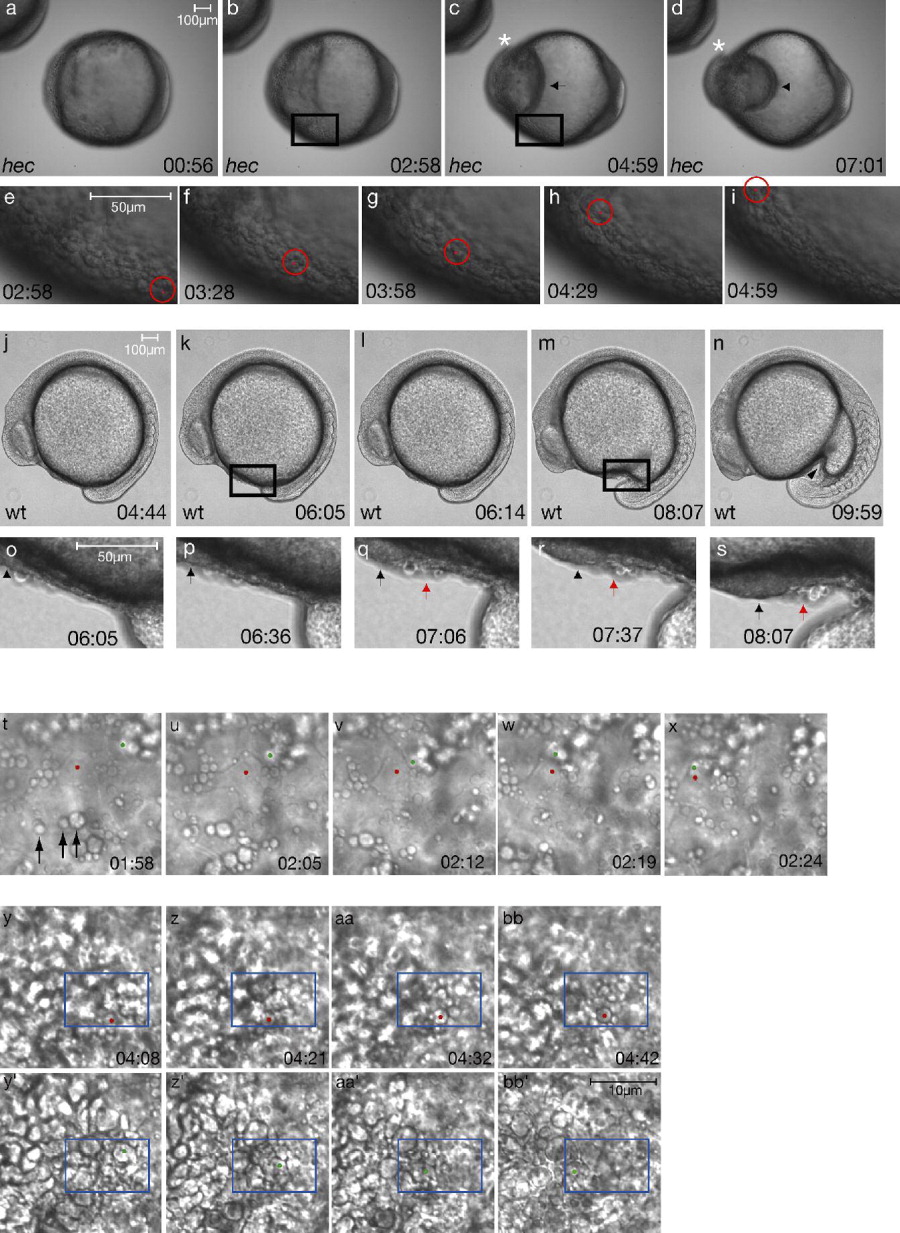
Fig. 3 Cells accumulate in the ventral region of the yolk during the somitogenesis stages. a-d: Stills from Supplementary Movie S1 of a radialized hec mutant embryo. c,d: The asterisks indicate the cap of accumulating postmigratory cells; the arrows show anterior limit of yolk cell. e-i: Movement of one cell (marked with red dot) traced over time. e and i are magnifications of boxed areas in b and c, respectively. j-n: Stills from Supplementary Movie S3 of the beginning of yolk extension formation in a wild-type embryo. o-s: Region of yolk extension during the initiation of its formation. Accumulation of cells occurs over time in the region anterior to the tail bud (red arrow). Black arrow (o-s) indicates posteriorly moving population of anteriorly derived prechordal plate cells. o and s are magnifications of boxed areas in k and m, respectively. Time shown is time elapsed since the beginning of the recording, which corresponds to approximately the tail bud stage. Anterior, left; posterior, right; dorsal (when distinguishable), top. t-x: High-magnification imaging of the leading edge of the anteriorly migrating cells, when anteriorly migrating cells appear relatively disperse. The movement of one cell (green dot, slightly out of focus, as it is in a more internal plane) is shown in relation to an enveloping layer (EVL) cell (red dot) over the yolk of a hec mutant embryo. Stills are from Supplementary Movie S2a. The migrating cell, in a lower focal plane, approaches and then travels under the EVL cell. Note, however, that the EVL cells also undergo some anterior displacement, albeit not as pronounced as that of the migrating internal cells. Arrows indicate round structures of various sizes on the outer surface, which are often observed at the boundaries of EVL cells. y-bb′: High-magnification imaging of the same embryo as in t-x later in development, when the anteriorly migrating cells travel en masse. The movement of one cell (green dot in y-bb) is traced in relation to overlying cells (red dot in y′-bb′). y-bb: Stills are from Supplementary Movie S2b showing the outer surface focal plane. At this stage, the characteristic flattened EVL morphology is less recognizable. The red dot indicates a relatively stationary surface structure. y′-bb′: same fields of view as y-bb, but focusing on the underlying cellular layer of migrating cells. Time shown is time elapsed since the beginning of the recording at the tail bud stage. Anterior, left; posterior, right. Scale bar in bb′ refers to panels t-bb′.