
|
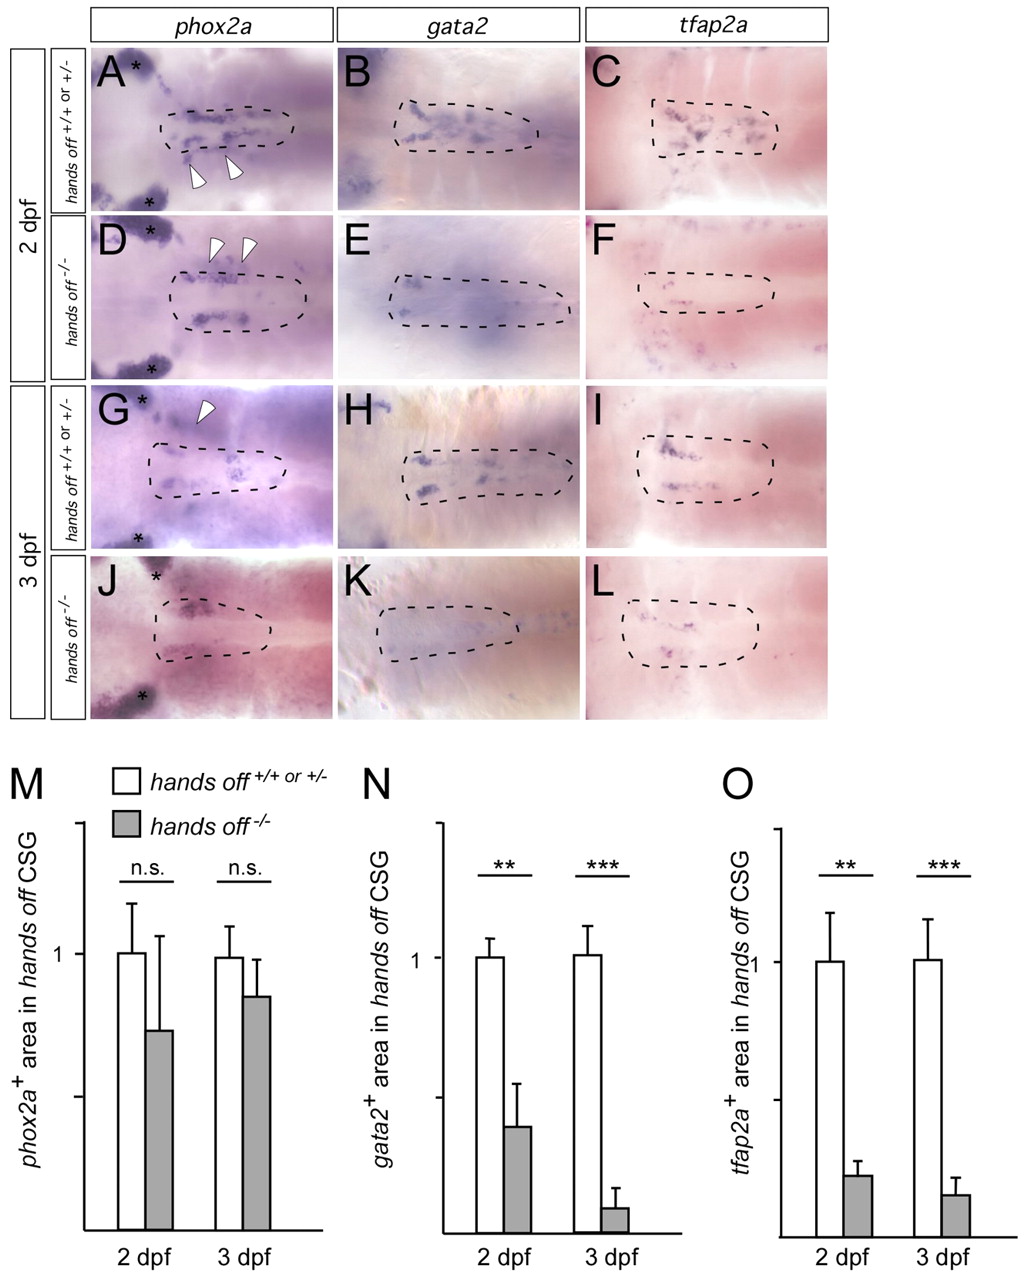
Fig. 5 phox2a, gata2 and tfap2a expression in cervical sympathetic ganglia of wild type and hands off mutants. Whole-mount in situ hybridizations viewed from dorsal. (A,D,G,J) phox2a-labeled sympathetic ganglia (dashed circle) and enteric neurons (white arrowheads). Control and hands off embryos show the same expression of phox2a at 2 dpf (A,D) and 3 dpf (G,J). gata2 expression is strongly reduced in hands off embryos (E,K) compared with wild-type embryos (B,H). tfap2a expression is massively reduced in hands off embryos (F,L) compared with wild type (C,I). (M) Area of phox2a-expressing cells at 2 and 3 dpf in hands off mutants compared with wild type. (Number of embryos analysed: seven wild type, three mutant for 2 dpf; ten wild type, five mutant for 3 dpf.) (N) Area of gata2-expressing cells at 2 and 3 dpf in hands off mutants compared with wild type. (Number of embryos analysed: six wild type, five mutant for 2 dpf; 12 wild type, nine mutant for 3 dpf.) (O) Area of tfap2a-expressing cells at 2 and 3 dpf in hands off mutants compared with wild type. (Number of embryos analysed: five wild type, 14 mutant for 2 dpf; 15 wild type, four mutant for 3 dpf.) Data are presented as mean ± s.e.m.; n.s. not significantly different (**P<0.01, ***P<0.001). Phox2a staining of epibranchial placodes is indicated by asterisks.