
Image
|
Figure Caption
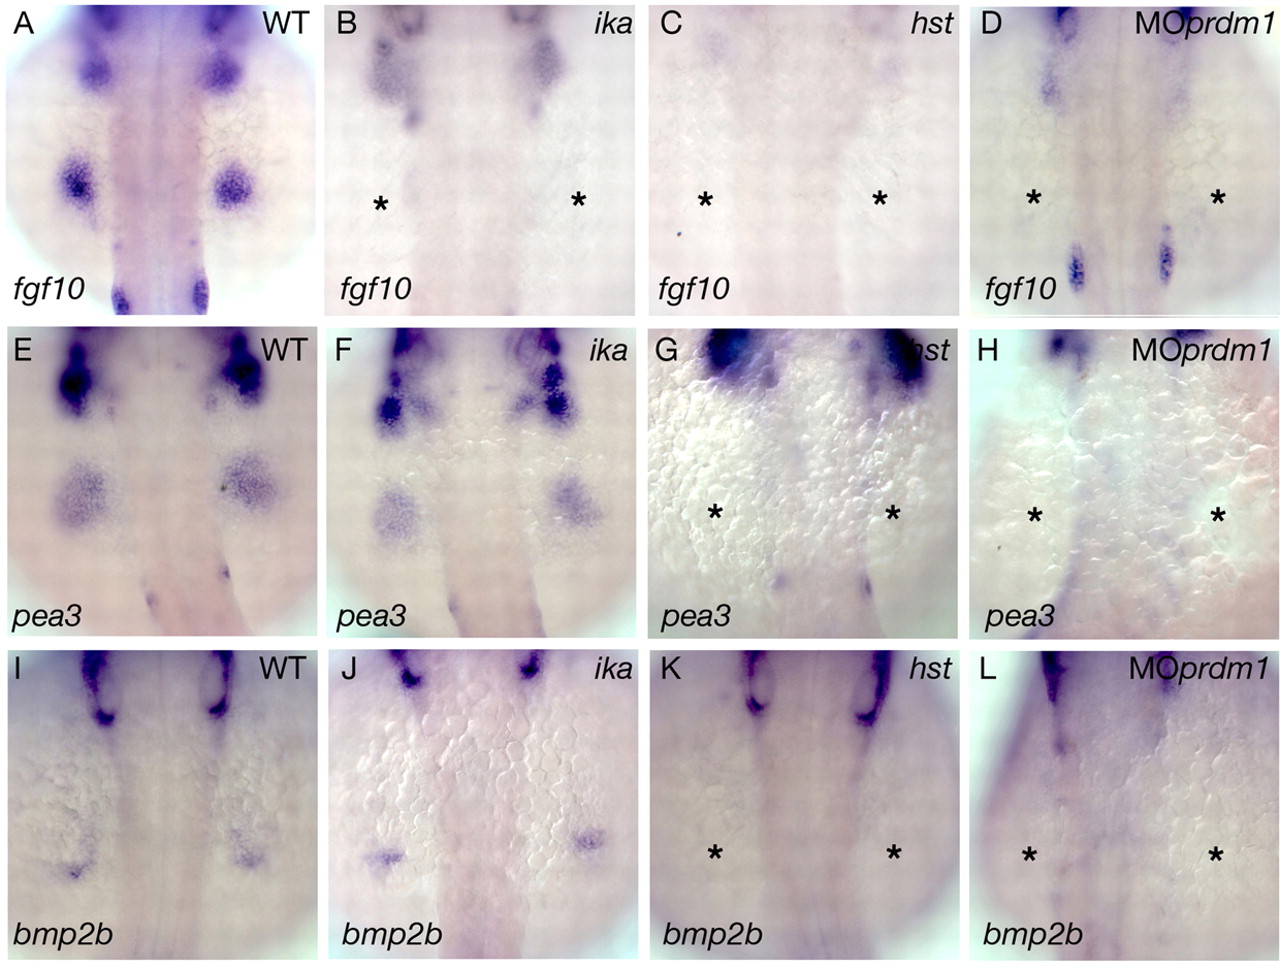
Fig. 8 Comparison of fgf10, pea3 and bmp2 expression in MOprdm1-injected embryos, and in hst and ika mutants. (A-L) Dorsal views of 30 hpf embryos stained for fgf10 (A-D), pea3 (E-H) or bmp2b (I-L) expression. While fgf10 expression is absent in ika, hst and MOprdm1 embryos (B,C,D), pea3 and bmp2b are transiently expressed in ika (F,J) but not hst or MOprdm1 embryos (G,H,K,L). Asterisks indicate a lack of marker gene expression within the pectoral fin mesenchyme. hst, heartstrings; ika, ikarus; MOprdm1, prdm1 morphant embryo; WT, wild type.
Figure Data
Acknowledgments
This image is the copyrighted work of the attributed author or publisher, and
ZFIN has permission only to display this image to its users.
Additional permissions should be obtained from the applicable author or publisher of the image.
Full text @ Development