
|
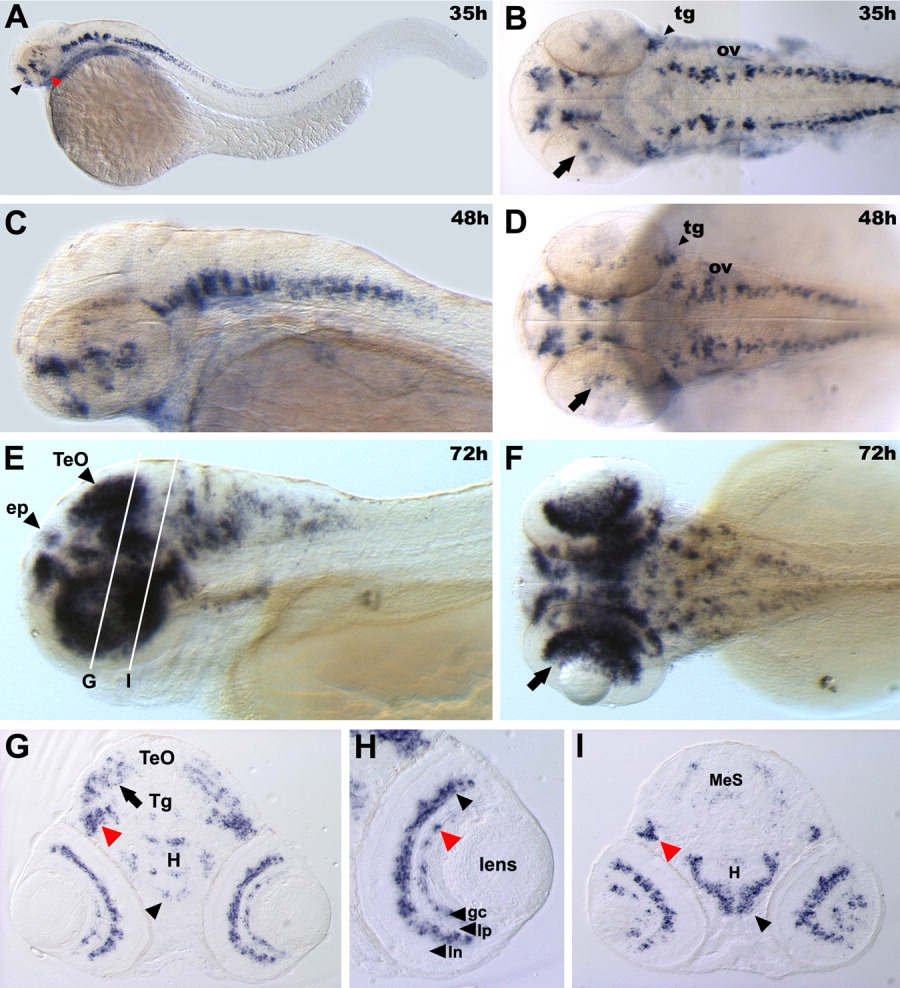
Fig. 3 Distribution of 1G5z transcripts during late embryogenesis. A: At 35 hours postfertilization (hpf). Lateral view. The red arrowhead indicates the hypothalamus; and black arrowhead indicates the telencephalon. B: Dorsal view of the brain domain of A. The arrow indicates new messages in the retina. C: At 48 hpf. Lateral view. D: At 48 hpf. Dorsal view. E: At 72 hpf. Lateral view. F: At 72 hpf. Dorsal view. G-I: Transverse section of the brain along the white lines in E. G,I: 1G5z-expressing cells are detected in the optic tectum (black arrow), lateral part of tegmentum (G, I, red arrowhead), and hypothalamus (G, I, black arrowhead). H: High-magnification view of the eye of G. 1G5z transcripts are detected in the proximal part of the inner nuclear layer (black arrow) and some ganglion cells (red arrowhead). Anterior part of all embryos is oriented to the left. ep, epiphysis; gc, ganglion cell layer; H, hypothalamus; In, inner nuclear layer; Ip, inner plexiform layer; MeS, mesencephalon; ov, otic vesicle; Tg, tegmentum; tg, trigeminal ganglion.