
Image
|
Figure Caption
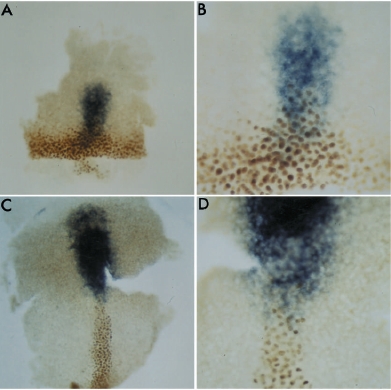
Fig. 6 The gsc and ntl-expressing regions resolve into two distinct cell populations in the course of gastrulation. In situ hybridizations revealing gsc message (blue), combined with antibody stainings showing the distribution of Ntl protein (brown). Two different magnifications of a 60% epiboly (A,B) and a 90% epiboly embryo (C,D) are shown, each one in a dorsal view. The pictures demonstrate overlap of gsc and ntl expression early during gastrulation, while 2 hours later the domains of expression have separated. The whole-mount preparations were dissected and flattened for photography.
Figure Data
Acknowledgments
This image is the copyrighted work of the attributed author or publisher, and
ZFIN has permission only to display this image to its users.
Additional permissions should be obtained from the applicable author or publisher of the image.
Full text @ Development