
|
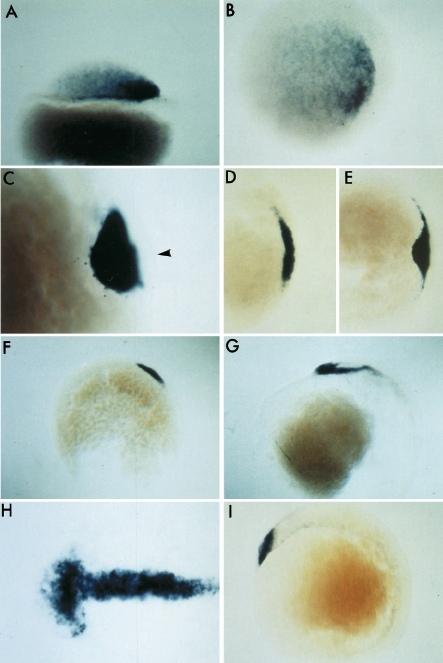
Fig. 3 Expression of zebrafish gsc during gastrulation. Dorsal is to the right except in B, D, E and H, which are animal pole views. Lateral view (A) and animal pole view (B) of a 3.5-hour-old blastula embryo; note the graded distribution of gsc transcripts. In an embryonic shield stage embryo (C), gsc is exclusively expressed in the first involuting cells at the dorsal side. Dorsal convergence at this stage leads to an accumulation of gsc-expressing cells in the hypoblast of the dorsal midline (E), leading to a thinning-out of gsc signal in the more lateral region, if compared to a slightly earlier stage (D; 40% epiboly). At 75% epiboly (F), gsc-expressing cells are at the leading edge of the dorsal hypoblast. (G,H) Lateral and animal pole views of the same embryo (tailbud stage, 10 h). There is strong staining in cells of the prechordal plate, with an arrowhead-shaped widening at the anterior most end of the hypoblast. One hour later (I), in a 2-somite embryo, staining in the dorsal midline has decreased in intensity, but there are still cells expressing high levels of gsc at the anterior tip of the hypoblast.