
Fig. 2
|
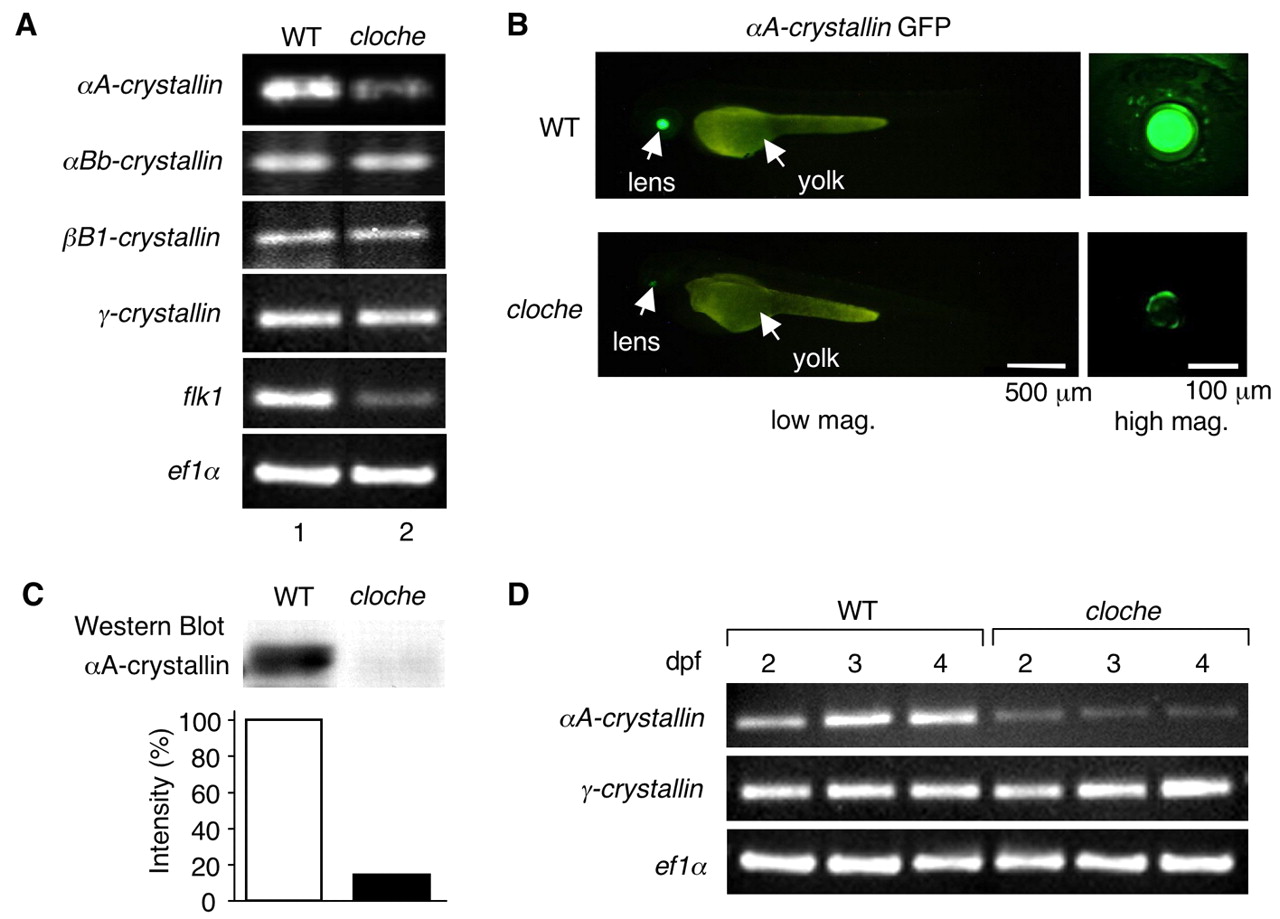
Fig. 2 crystallin gene expression. (A) Zebrafish embryo (2.5 dpf) mRNA expression levels were analyzed by semi-quantitative RT-PCR. Lane 1, wild type; lane 2, cloche. Wild-type versus cloche gene expression is shown for αA-crystallin, αBb-crystallin, ßB1-crystallin, γ-crystallin and flk1 (vegfr2). ef1a was used as a loading control. (B) &alphaA-crystallin promoter-EGFP was injected into one- to four-cell stage embryos and fluorescence (green) was measured at 2.5 dpf. Lateral views are shown at low and high magnifications. Fluorescence was found only in the lens and was greatly diminished in the cloche lens. (C) Western blot. Total protein as described in Fig. 1A were extracted and lysates (2 µg) were separated by SDS-PAGE and analyzed by western blotting with anti-αA-crystallin. The bands were analyzed by an image analysis program (ImageJ) and the values were normalized to wild-type bands being 100%. (D) Crystallin expression as function of development. Zebrafish embryo (2-4 dpf) mRNA expression levels were analyzed by semi-quantitative RT-PCR. Wild-type versus cloche gene expression is shown for αA-crystallin and γ-crystallin expression. ef1a was used as a loading control.