
|
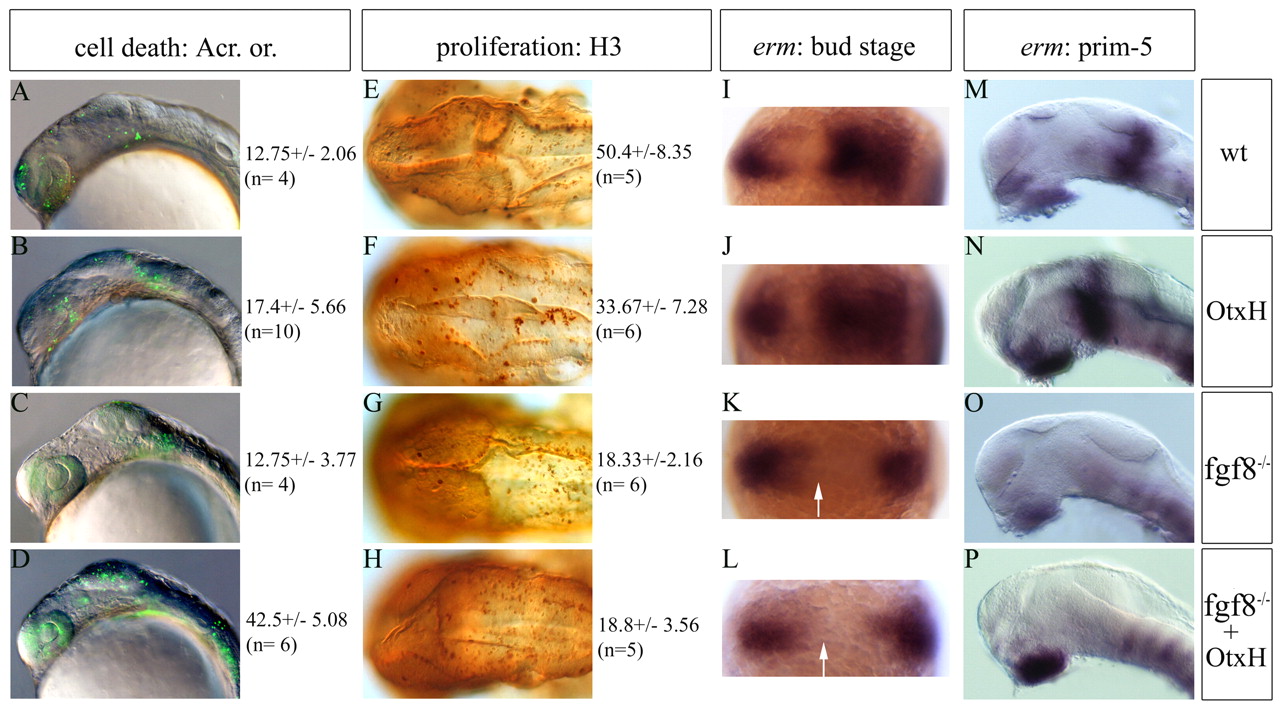
Fig. 6 fgf8-/-; OtxH embryos have a total lack of Fgf activity and show both a proliferation decrease and a cell death increase. (A-D) Lateral view of 20-somite stage live embryos stained with Acridine Orange and cell quantification (n, numbers of quantified embryos). No change in cell death is observed in fgf8-/- mutant embryos (compare A with C), while OtxH shows an increase in dying cells (B), which is enhanced in fgf8-/-; OtxH (D). These differences are more drastic at prim-22 stage (wild type: 18±4, n=3; OtxH 26±2, n=3; fgf8-/-: 12±2, n=3; fgf8-/-; OtxH: 44.33±6.03, n=3). (E-H) Dorsal views of prim-22 stage posterior brain immunostained with the H3 reveal a decrease in proliferation rate in fgf8-/- mutant (G), while lack of Otx in this context does not worsen the phenotype (H), see also quantifications. (I-P) erm expression pattern in the mid/hindbrain region of the genetic context studied at bud stage (dorsal view, I-L) and at prim-5 stage (lateral view, M-P). This Fgf transcriptional target is never induced in the presumptive mes/met (arrow) in fgf8-/- (K,O) or fgf8-/-; OtxH (L,P) embryos.