
|
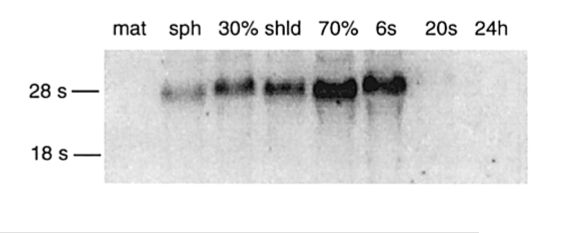
Fig. 1 Sequence conservation and expression of zebrafish chordin. (A) The alignment compares the amino acid sequence of zebrafish Chordin with Xenopus Chordin and Drosophila Short gastrulation. Stars and dots indicate identical amino acids and conservative amino acid substitutions, respectively. Cysteine-rich repeats are outlined in boxes and the region corresponding to the CR1 PCR amplification product is shown in gray. (B) The numbers indicate the percentages of amino acid identity within and outside the CR repeats (shaded) in the three proteins (proteins are not drawn to scale). (C) Northern blot analysis demonstrates that a single chordin transcript is present at low lowels in the late blastula, increases during gastrulation, and persists through early somitogenesis. RNA was collected from embryos prior to midblastula transition (mat) and at sphere stage (sph), 30% epiboly (30%), 50% epiboly (shld), 70% epiboly (70%), 6 somites (6s), 20 somites (20s), and 24 h postfertilization (24h). For this blot, the probe was a HinfII restriction fragment (601) bp) that included CR3 and CR4
Reprinted from Developmental Biology, 192, Miller-Bertoglio, V.E., Fisher, S., Sanchez, A., Mullins, M.C., and Halpern, M., Differential regulation of chordin expression domains in mutant zebrafish, 537-550, Copyright (1997) with permission from Elsevier. Full text @ Dev. Biol.