
|
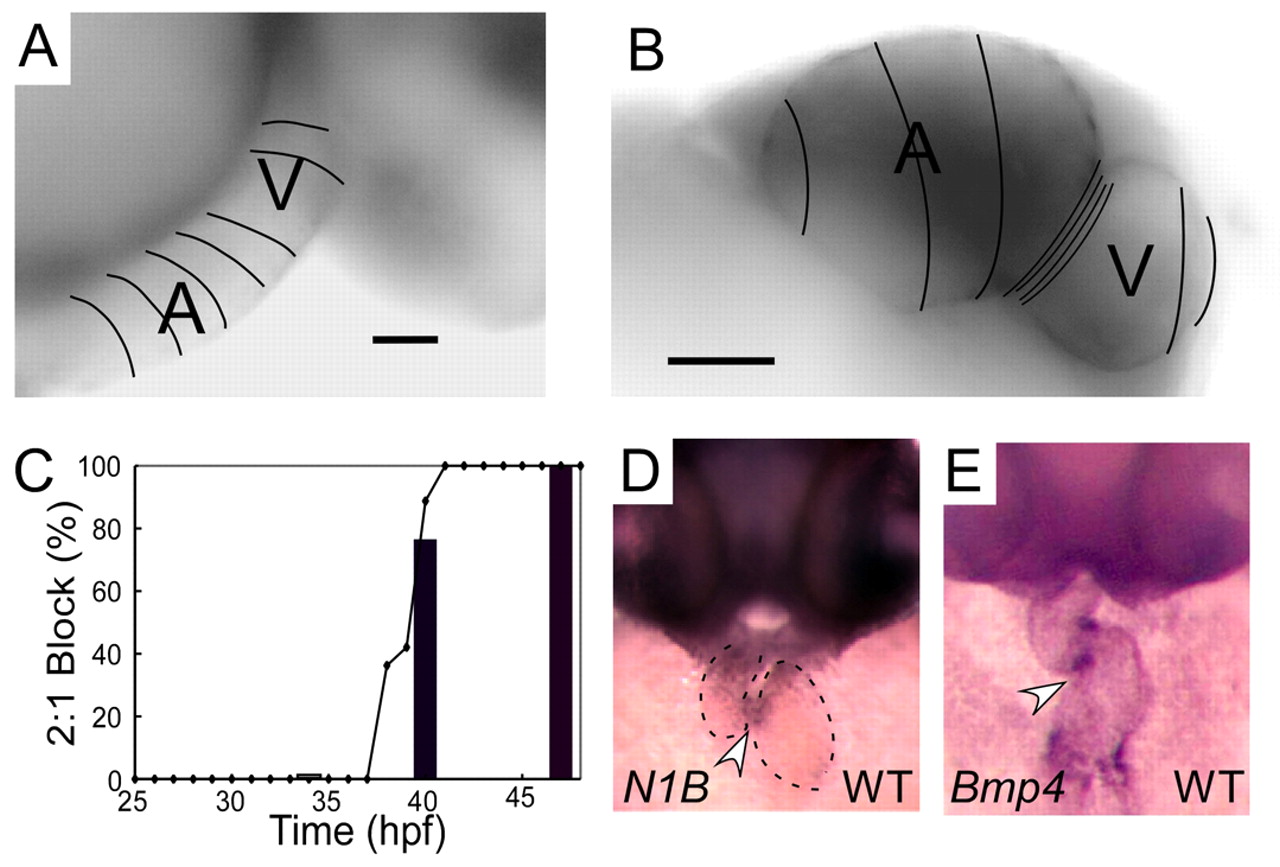
Fig. 1 Normal development of AV conduction tissue. (A,B) Calcium activation maps from a single cardiac cycle in wild-type zebrafish at 36 hpf (A) and 48 hpf (B). Isochronal lines (50 mseconds) obtained by fluorescence microscopy are superimposed on maximum intensity projection images. These data demonstrate smooth conduction throughout the heart with ventricular acceleration at 36 hpf (A). Marked slowing at the AV junction can be seen at 48 hpf (B). Scale bars: 25 μm in A; 50 μm in B. (C) Time course of onset of 2:1 or higher grade AV block in response to atrial pacing (bars) or terfenadine (line) expressed as a percentage of the embryos studied. (D,E) In situ expression patterns of notch1b (D) and bmp4 (E) in wild-type embryos at 48 hpf. Arrowheads indicate expression in the AV ring a dotted line outlines the cardiac silhouette in D.