
|
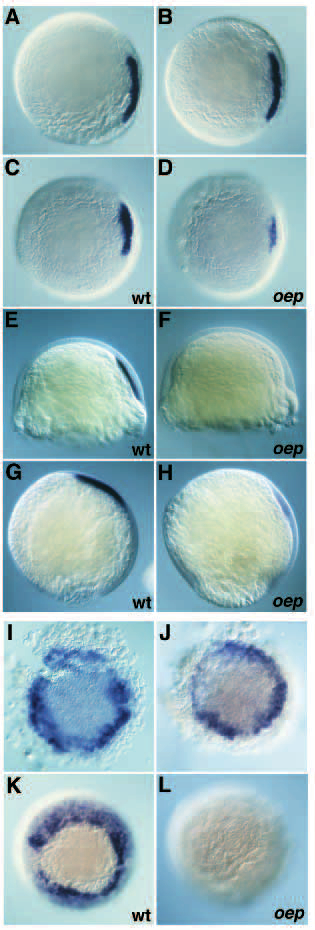
Fig. 4 Expression of goosecoid is initiated but not maintained in oep mutants. (A-H) Gsc expression at 45% epiboly (A,B); 50% epiboly (C,D); after shield formation (E,F) and at 90% epiboly (G,H) in wild-type (C,E,G) and oep mutant embryos (D,F,H). (A-D) animal pole view, dorsal is to the right; (E-H) lateral view, dorsal is to the left, animal pole is up. Embryos in A,B could be either wild-type or mutant. Note the loss of gsc expression in oep mutants at the onset of involution. (I-L) Expression of gsc in Li-treated embryos; animal pole view. Embryos derived from a cross of oep/+ heterozygous fish were incubated in 0.3 M LiCl at the 256-512 cell stage as described by Stachel et al. (1993). (I,J) 45-50% epiboly; (K,L) 9.5 hpf. 28/28 (100%) Li-treated embryos derived from a cross of oep/+ heterozygous fish expressed gsc at 45-50% epiboly in the entire margin (I,J), but 18/57 (31% compared to an expected 25%) Li-treated embryos derived from a cross of oep/+ heterozygous lacked gsc expression at 9.5 hpf (L). 81/81 (100%) Li-treated embryos derived from a cross of wild-type fish expressed gsc at 9.5 hpf (K).