
|
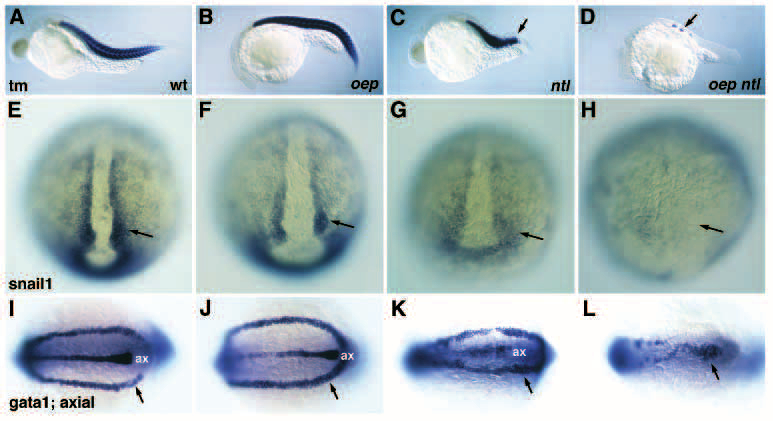
Fig. 12 Expression of mesodermal markers in oep ntl double mutants. (A-D) Expression of a- tropomyosin (tm) in wild-type (A), oep mutant (B), ntl mutant (C) and oep ntl double mutant (D) embryos at 26 hpf. Wild-type and oep mutant embryos have 30-32 somites at this stage, whereas ntl mutants have 15-17 somites (arrow). Note the dramatic deficit in tm expression in oep ntl double mutants (arrow in D). (E-H) Expression of snail 1 in wild-type (E), oep mutant (F), ntl mutant (G), and oep ntl double mutant (H) embryos at the bud stage. Note (arrows) the mild reduction of snail1 expression in ntl mutant embryos (G), and the severe deficit of snail1 expression in oep ntl double mutants (H). (I-L) Expression of gata1 and axial in wild-type (I), oep mutant (J), ntl mutant (K), and oep ntl double mutant (L) embryos at the 11-somites stage. Note the severe reduction of gata1 expressing cells (arrow) in oep ntl double mutant embryos (L); ax, axial expression in the midline. Assignment of gata1 (arrow) and axial (ax) expression domains is based on the analysis of embryos stained with either probe alone (data not shown).