
|
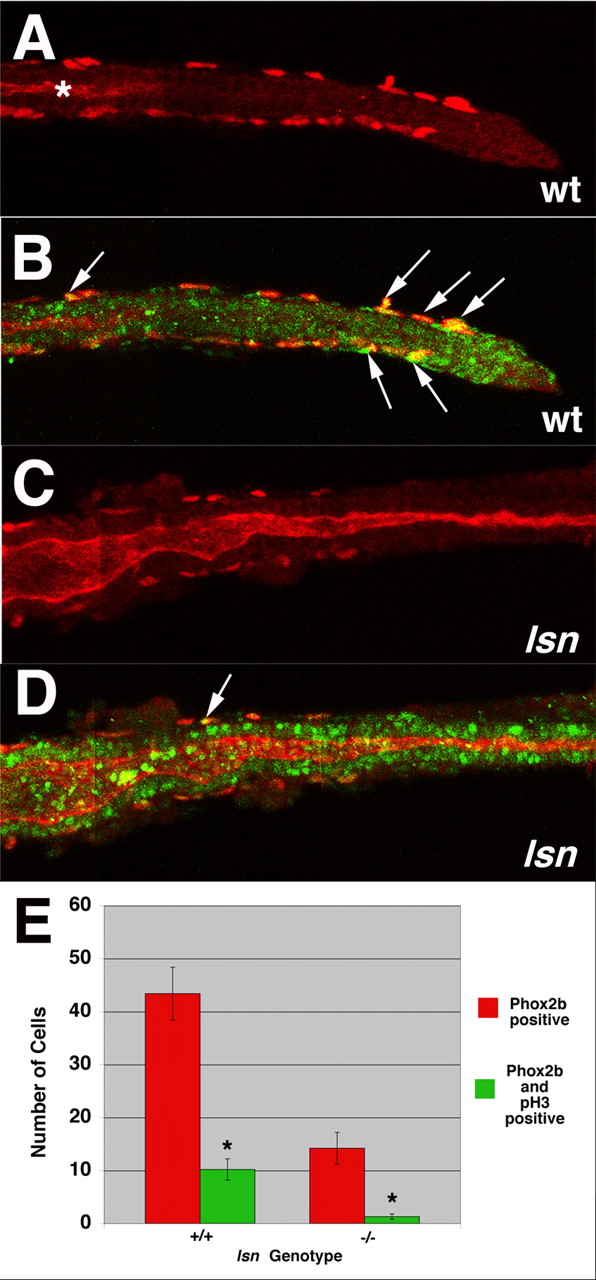
Fig. 8 lsn mutants have reduced ENS precursor proliferation. (A-D) Confocal images of dissected intestines from 48 hpf wild-type (A,B) and lsn (C,D) embryos immunocytochemically stained with anti-Phox2b antibody (red) and anti-phosphohistoneH3 antibody (green). (A,C) Anti-Phox2b immunoreactivity in wild type (A) and lsn (C), showing the most posterior point along the gut tube that Phox2b-positive cells can be identified. (B,D) Merged images of the intestines in A and C showing anti-Phox2b and anti-phosphohistone H3 immunoreactivity (arrows). Asterisk in A indicates the end of the gut lumen, which is not opened up to the distal end of the gut tube at this developmental age. Arrows in B,D indicate double-labelled cells. (E) Bar graph showing the mean number of Phox2b immunoreactive cells (red) and double-labelled Phox2b/phosphohistone H3 positive cells (green) present along the entire length of the intestine of 48 hpf wild-type and homozygous mutant lsn embryos. Embryos derived from an incross of heterozygote lsn fish were fixed and stained with anti-Phox2b and anti-phosphohistone H3 antibodies at 96 hpf and genotyped. Numbers represent the mean number of immunopositive cells±s.e.m. for 10 embryos of each genotype. The difference between them was statistically significant (Student's t-test, *P<0.001).