
|
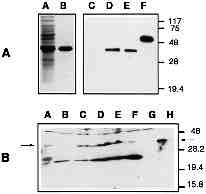
Fig. 4 (A) Specificity of anti-Sna-1 antibodies. Coomassie-bluestained SDS-PAGE gel (lanes A, B) and Western blot (lanes C-F) showing total protein from induced (lanes A,D) and uninduced bacteria (lane C) carrying expression vector pQE12-sn, and Ni- NBT purified protein from pQE12-sn containing (lanes B,E) and pQE16-snD114 containing bacteria (lane F). The band with an apparent Mr of 39x103 was used to raise the antiserum. (B) Temporal expression pattern of Sna-1 protein. Western blot showing Ni-NBT-purified protein of pQE12-sn carrying bacteria (lane H) and total protein equivalent to 2-3 zebrafish embryos of following stages: 1-64 cells (lane A), sphere (lane B), shield (lane D), tailbud (lane E), 1 day (lane F) and 6 days (lane G). The zebrafish Sna-1 band was identified by comparison of the protein pattern of sphere-stage embryos, which were either untreated (lane B) or injected with pBS-sn3 encoded sna-1 sense RNA in the 1-cell stage (lane C). The injection leads to the exclusive increase of one band of an apparent Mr of 39x103 which comigrates with the pQE12-sn expressed recombinant protein.