
|
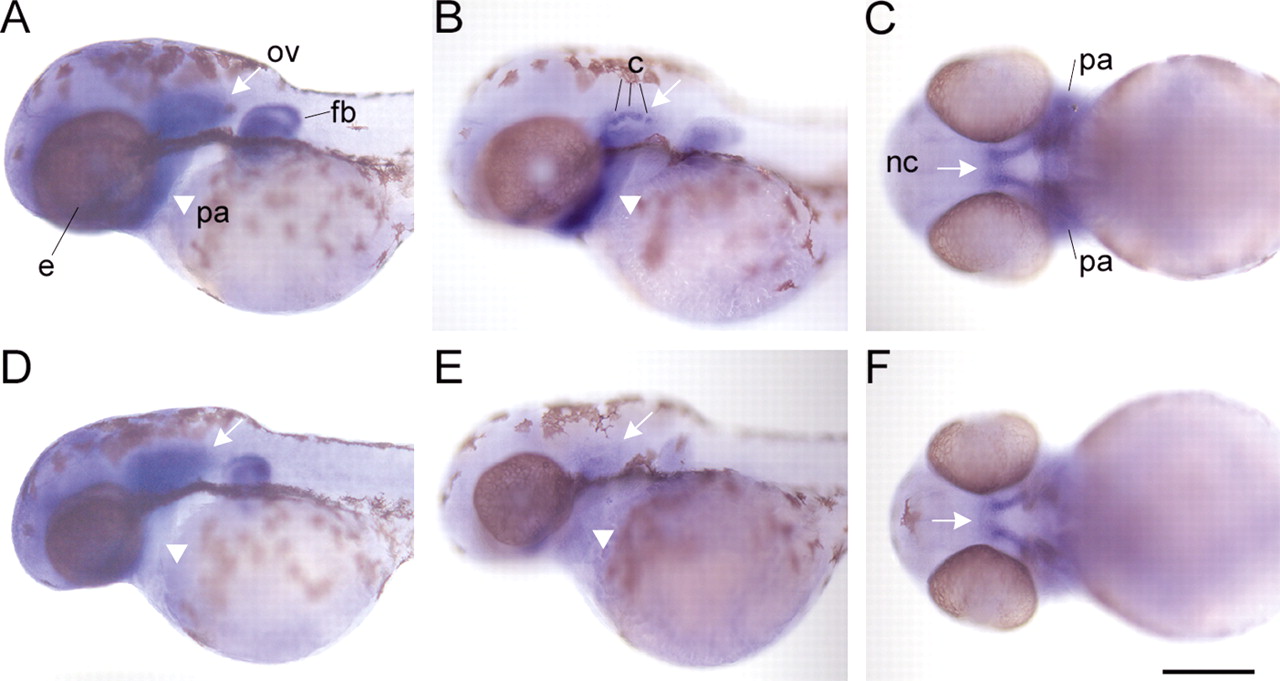
Fig. 8 In situ analysis of cartilage differentiation in dfna5 morphants. (A,D) Lateral view of col2a1 expression at 55 hpf. White arrows indicate the otic vesicle; white arrowheads indicate pharyngeal arches. Expression in the morphant otic vesicle (D) is unaffected compared with wild type (A). (B,C,E,F) ugdh expression in wild-type (B,C) and morphant (E,F) 55 hpf embryos. (B,E) Lateral view. (E) Expression in the developing morphant ear columns (indicated on wild type) and pharyngeal arches (white arrowhead) is reduced compared with wild-type (B). (C,F) Ventral view of expression in the developing neurocranium reveals no difference between wild-type and morphant embryos (arrows in C and F). Scale bar: 200 µm. c, column; e, eye; fb, fin bud; nc, neurocranium; ov, otic vesicle; pa, pharyngeal arches.