
Fig. 3
- ID
- ZDB-IMAGE-051222-2
- Genes
- Publication
- Kohli et al., 2005 - Potential targets of transforming growth factor-beta1 during inhibition of oocyte maturation in zebrafish
- All Figures
- Figures for Kohli et al., 2005
|
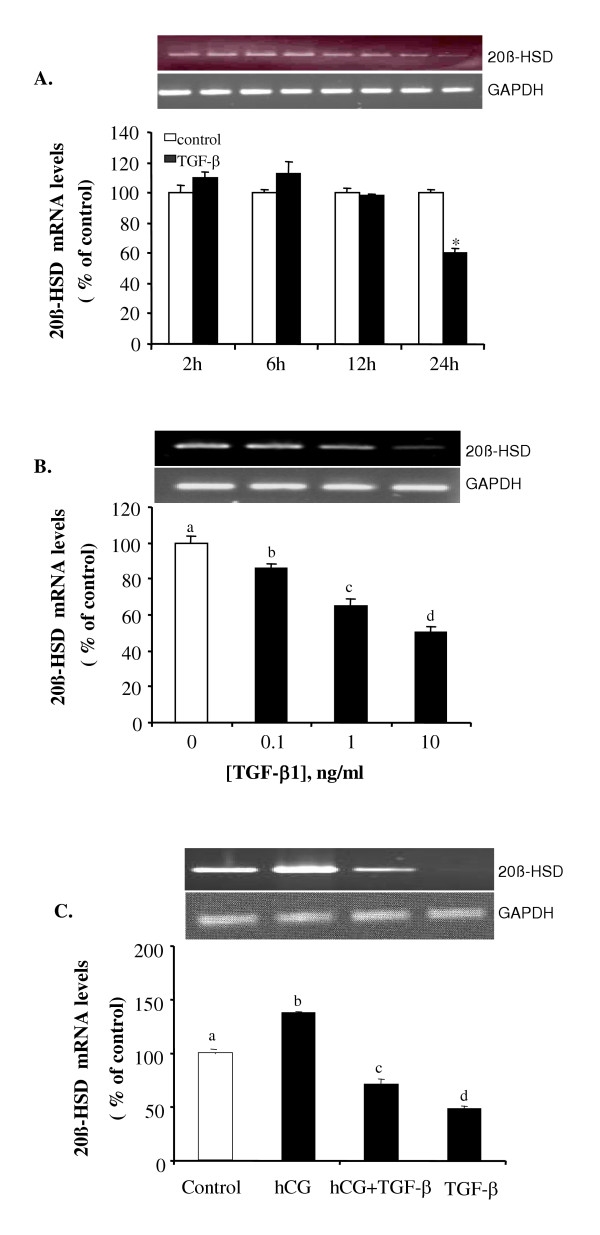
Fig. 3 TGF-β1 inhibits mRNA expression of 20β-HSD. (A) Follicles were treated with control medium or 10 ng/ml of TGF-β1 for 2, 6, 12 and 24 hours. (B) Follicles were treated with different concentrations (0, 0.1,1 and 10 ng/ml) of TGF-β1 for 18 hours. (C) Follicles were treated with control medium, hCG (100 IU/ml), TGF-β1 (10 ng/ml), or hCG+ TGF-β1 for 18 hours. Total RNA was extracted and subjected to RT-PCR using primers for 20β-HSD and GAPDH. Each value represents the mean ± SEM of three replicates in one representative RT-PCR reaction. 20β-HSD mRNA levels are expressed as percent of control after normalized with the GAPHD levels. Different letters above the bars denote statistical significance (P < 0.05). *, P < 0.05 vs. control. The insets show representative ethidium bromide stained gels. GAPDH gels are the same for Figs. 4-7.