
IMAGE
Fig. 2
Image
|
Figure Caption
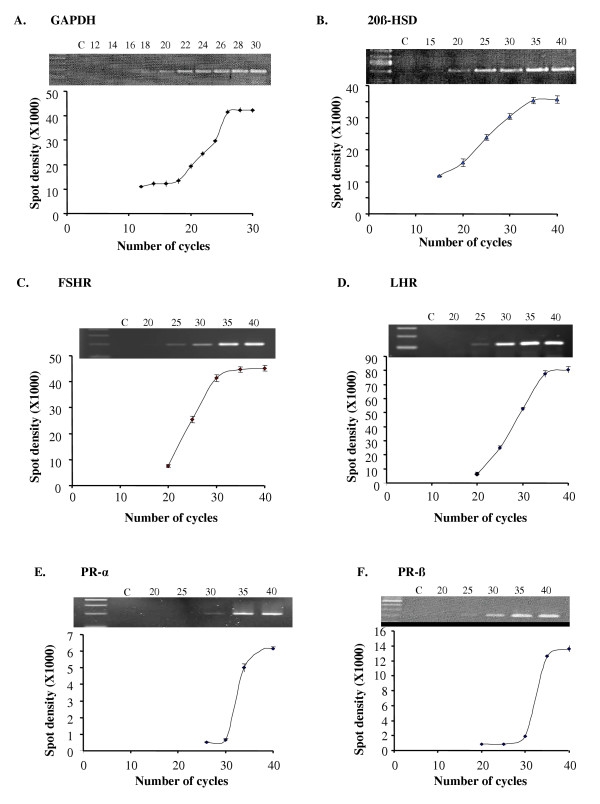
Fig. 2 Validation of semi-quantitative RT-PCR for GAPDH (A), 20βHSD (B), FSHR (C), LHR (D), mPR-α (E) and mPR-β (F). PCRs were performed using zebrafish ovarian cDNA as the template, amplified for varying cycle numbers and the density of the PCR products was quantified. Each value represents the mean ± SEM of three replicates in one representative RT-PCR. Representative ethidium bromide stained gel pictures were included. C = negative control; number on each lane represents the number of PCR cycles performed.
Figure Data
Acknowledgments
This image is the copyrighted work of the attributed author or publisher, and
ZFIN has permission only to display this image to its users.
Additional permissions should be obtained from the applicable author or publisher of the image.
Full text @ Reprod. Biol. Endocrinol.