
|
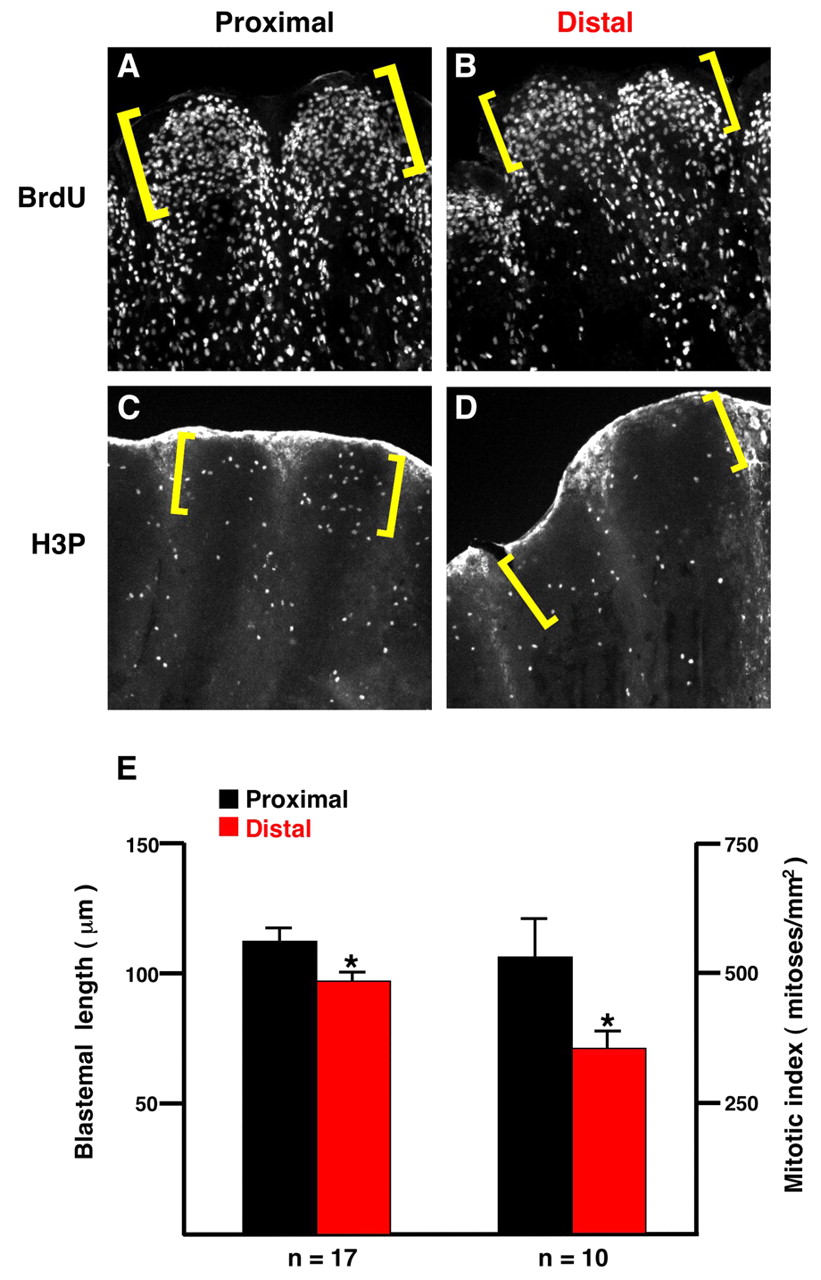
Fig. 2 Blastemal length and mitotic index depend on PD position. (A,B) Proximal and distal 3 dpa regenerates (33°C) of the same fin stained for BrdU incorporation (fins collected 30 minutes post-injection). The proximal regenerate has a greater PD length of especially BrdU-dense blastemal mesenchyme (brackets). (C,D) Proximal and distal 3 dpa regenerates of the same fin stained for phosphorylated Histone-3 (H3P), an indicator of mitosis. Fine points indicate individual mesenchymal mitotic nuclei. This particular fin was chosen because even though it has similar blastemal sizes for the proximal and distal regenerates (brackets; actual BrdU stain is not shown), there are clearly more H3P-positive cells in the proximal blastema. As reported previously, fins show non-specific epidermal fluorescence at the distal edge of the regenerate (Poss et al., 2002b). (E) Quantification of blastemal length and mitotic index at 3 dpa (*P<0.05, t-test).