
|
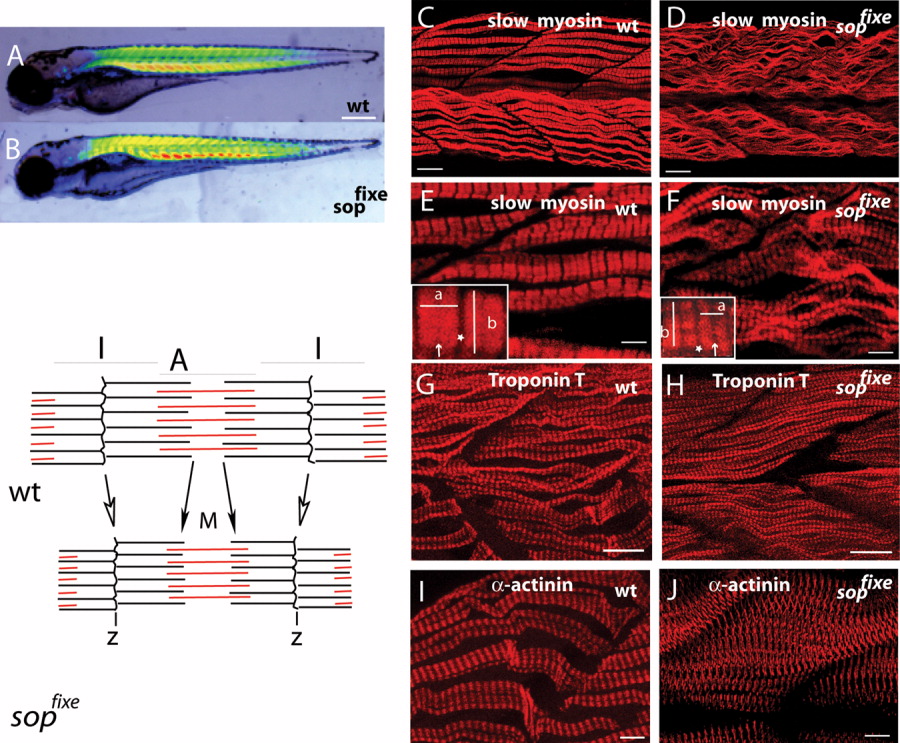
Fig. 1 Structure of myofibrils in sopfixe mutants. A,B: Birefringence at the flank of wild-type (A) and sopfixe (B) embryos. C-J: Wild-type (C,E,G,I) and sopfixe (D,F,H,J) embryos stained with antibodies against slow muscle myosin (C-F), troponin T (G,H), alpha-actinin (I,J) at 26 hours postfertilization (hpf; C-H) or 48 hpf (I,J). Immunoreactivity of slow muscle myosin highlights the A band (E, F) and α-actinin marks the Z-disc. The I band and M band are indicated by an asterisk and arrow, respectively. E,F: The length of the A band (a = 1.63 μm for wild-type [wt], E, and 1.3 μm for sopfixe, F) and the width of the myofibril (b = 2.3 μm for wt, E, and 1.9 μm for sopfixe, F) are reduced in the mutant. Schematic representation of the sarcomere structure in wild-type and sopfixe embryos. Note the enlargement of the M band and the shortening of the A band. Lateral views, anterior to the left. Scale bars = 100 μm in A,B; 10 μm in C,E; 2.5 μm in E,F; 15 μm in G,H; 8 μm in I,J.