
|
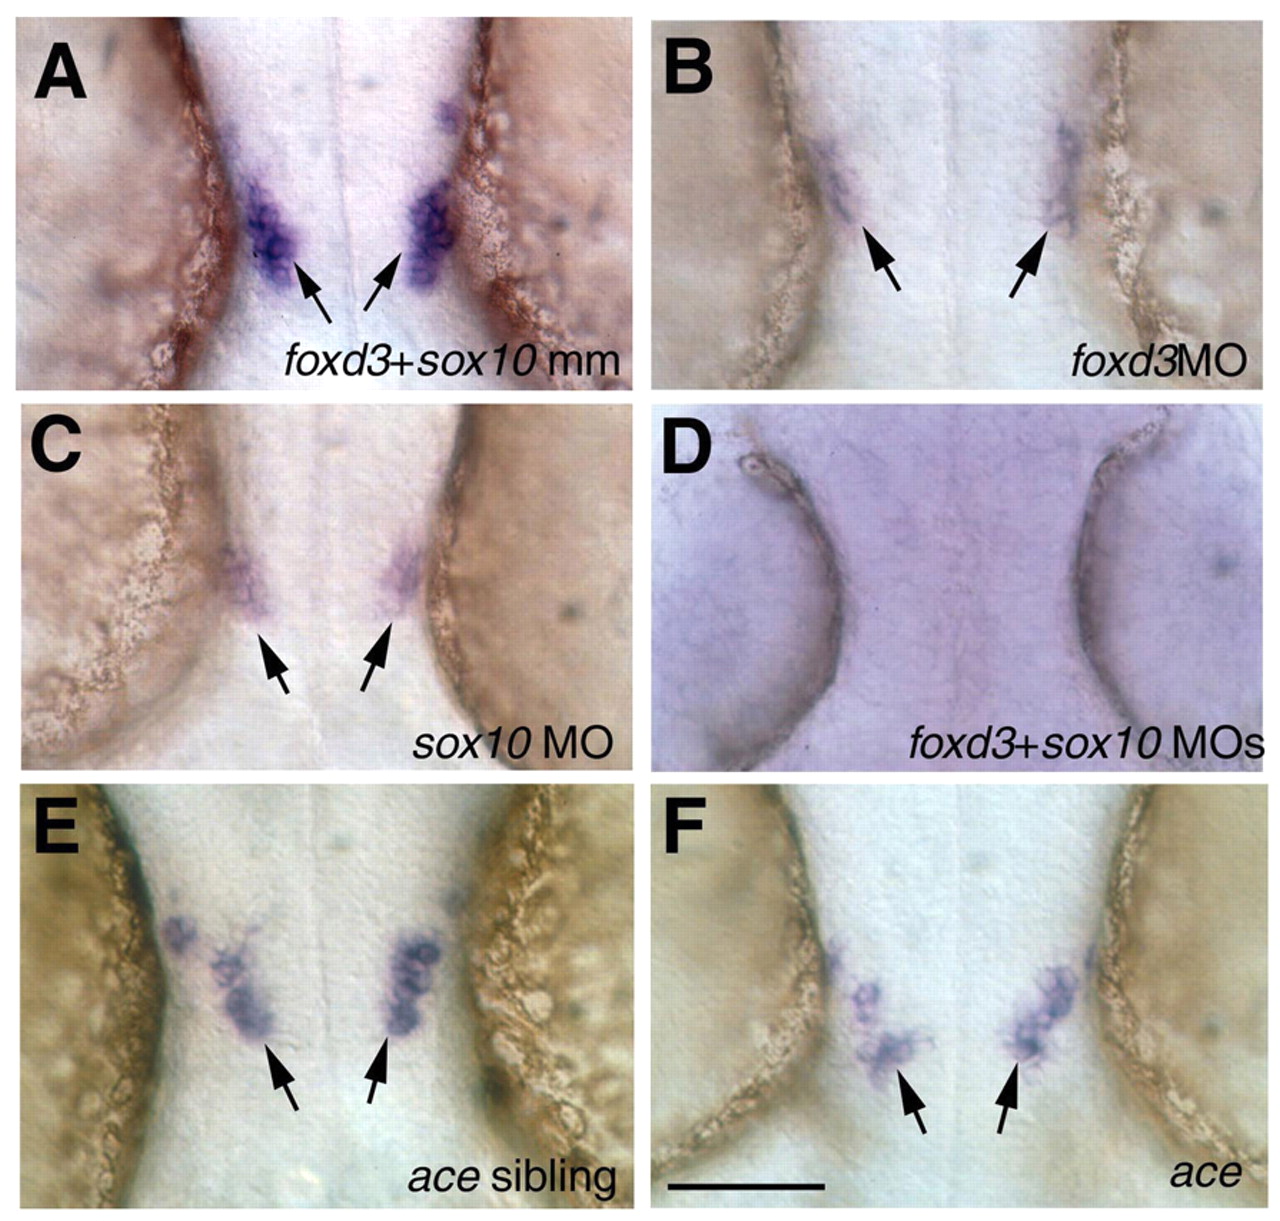
Fig. 3 Role of foxd3, sox10 and fgf8 in the development of midbrain gnrh2 cells. Dorsal views of whole-mount preparations, showing gnrh2 expression in the head of embryos at 35α1 hpf. (A-D) The effects of knockdown of foxd3 and sox10. (A) foxd3+sox10 mismatch control embryos, showing a normal complement of gnrh2 cells (arrows) (Gopinath et al., 2004. foxd3 (B) and sox10 (C) morphant animals showed significantly fewer gnrh2 cells than did mismatch control embryos (A), whereas animals injected with both foxd3 and sox10 MOs (D) showed a complete loss of gnrh2 cells (see Table 1). (E,F) Role of fgf8 in gnrh2 development. (E) Expression of gnrh2 in an ace non-mutant sibling control. (F) ace mutant embryo showing the normal number of gnrh2-expressing cells (see Table 1). Scale bar: 100 µm.