
|
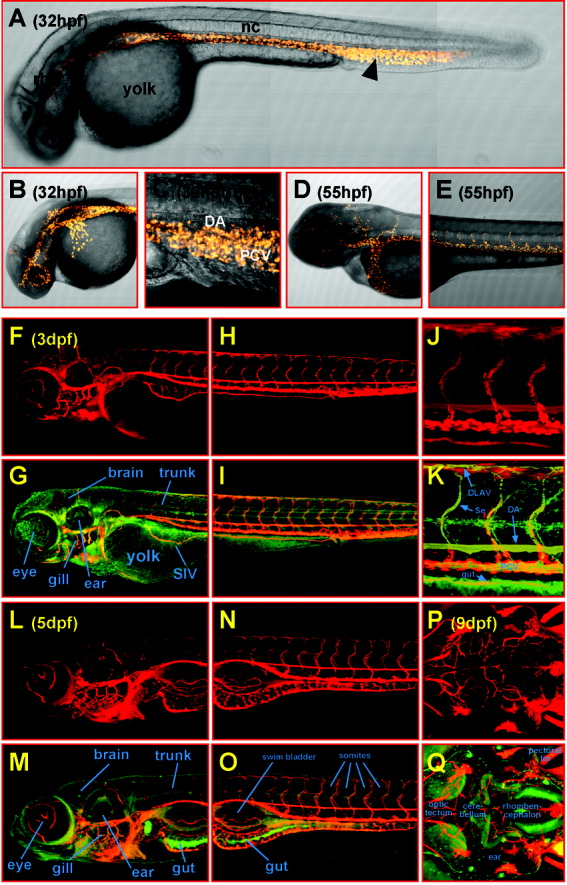
Fig. 4 Quantum dot microangiography. Living zebrafish embryos of progressing developmental stages were injected into the heart ventricle with a 1 μM suspension of streptavidin-conjugated QD605 to label the vasculature by virtue of the blood flow carrying the quantum dots through the entire vascular network. Subsequently, laser scanning confocal microscopy was used to record the distribution of the quantum dots. A: Lateral view of a 32 hours postfertilization (hpf) embryo; the vasculature is quite primitive, consisting mainly of a major artery and vein running below the notochord (nc). B,C: Injected QD605 attach in clusters to the vascular endothelium (B, maximum intensity projection of 100 sections each 3 μm apart, see also Movie 1 for motility of attached QD605) and accumulate in reticular cells (A, arrowhead; C, maximum intensity projection of 61 sections each 2.5 μm apart). D,E: These deposited QD605 might serve during ongoing embryogenesis as a source to label the endothelium of newly forming blood vessels (55 hpf, D, maximum intensity projection of 100 sections each 3 μm apart; E, maximum intensity projection of 85 sections each 2 μm apart). F-K: At 3 days postfertilization (dpf; F-K, lateral views), the vasculature is by far more elaborate, forming a dense network in the head (F,G, maximum intensity projection of 71 sections each 5 μm apart) and trunk (H,I, maximum intensity projection of 71 sections each 3 m apart). G,I,K: Counterstaining with Bodipy Ceramide was used to visualize the morphological context. L-O: At 5 dpf (L-O, lateral views), the gills (L,M, maximum intensity projection of 51 sections each 5 μm apart) and intestinal region (N,O, maximum intensity projection of 115 sections each 2 μm apart) have acquired a branched vascular network. M,O,Q: Bodipy Ceramide counterstaining. P,Q: Finally, at 9 dpf (dorsal views, maximum intensity projection of 122 sections each 2 μm apart) the vasculature interweaving the midbrain hindbrain region was imaged deep to the ventral brain area. For three-dimensional animations of the vasculature at 3, 5, and 9 dpf, see also Movies 2-4. SIV, subintestinal vein.