
|
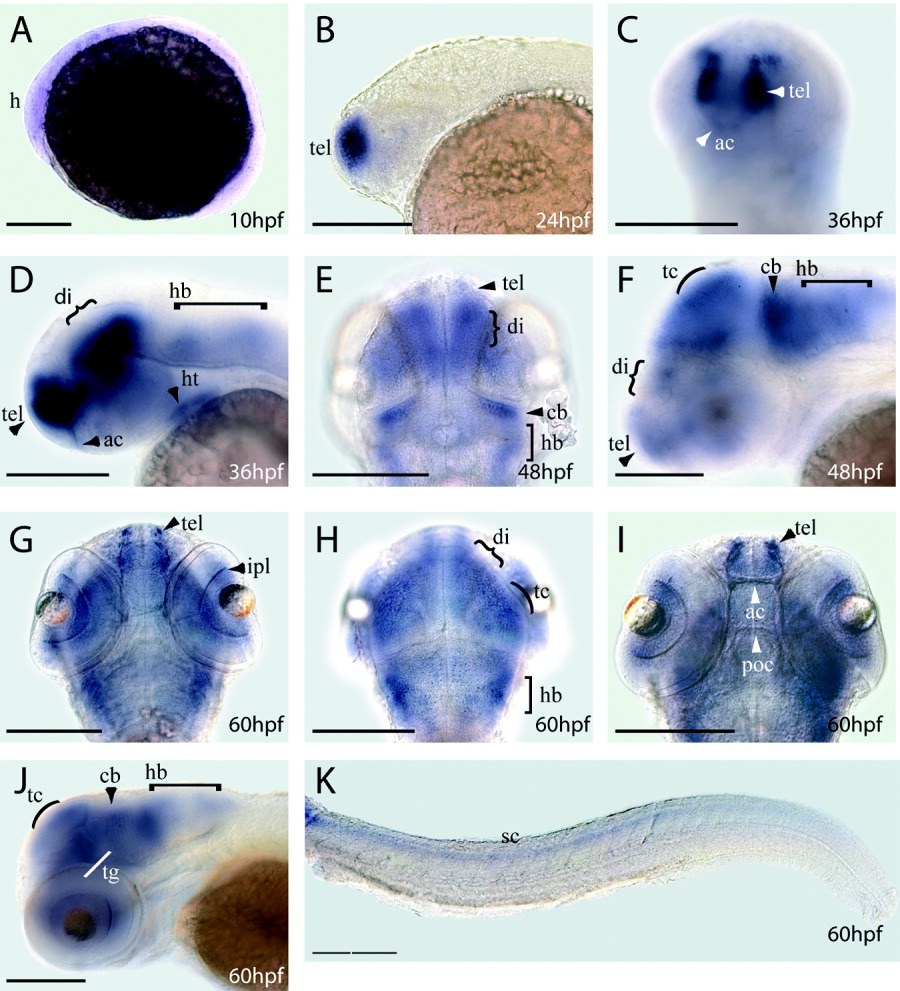
Fig. 3 Whole-mount in situ hybridization analysis of foxP2 RNA expression during zebrafish development, stages 10 to 60 hpf. A: Lateral view at 10 hpf. B: Lateral view at 24 hpf. C: Oblique rostral view at 36 hpf. D: Lateral view at 36 hpf. E: Dorsal view at 48 hpf. F: Lateral view at 48 hpf. G,H: Dorsal views at 60 hpf in two different focal planes. I: Dorsal view focused on axon tracts at 60 hpf. J: Lateral view at 60 hpf. K: Lateral view at 60 hpf of expression in the spinal cord. Lateral views: anterior to the left; dorsal views: anterior to the top. Scale bars are 50 μm. ac, anterior commissure; cb, cerebellum; di, diencephalon; h, head region; hb, hindbrain; ht, heart; ipl, inner plexiform layer; poc, post-optic commissure; rgc, retinal ganglion cells; sc, spinal cord; tc, tectum; tg, tegmentum; tel, telencephalon.