
|
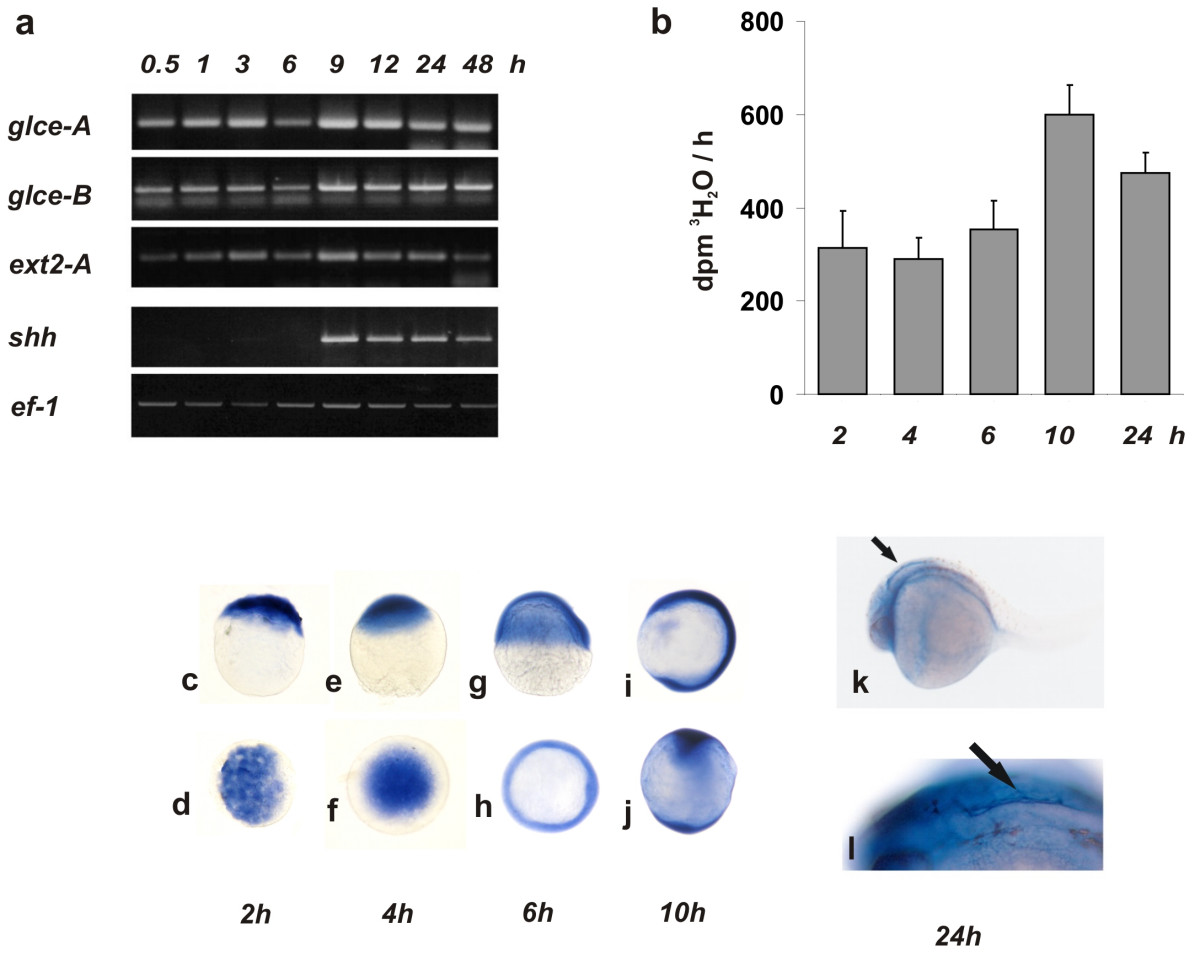
Fig. 2 glce mRNA expression pattern in developing embryos. (a) RT-PCR analysis of the transcript level. Thirty embryos were collected in Tri-Reagent at different developmental stages as indicated. cDNA was generated from total RNA (1 µg) using Sensiscript reverse transcriptase primed with oligo-dT at 37°C for 2 h. PCR reactions (25 cycles) were performed in duplicate and analyzed on 1% agarose gel. (b) Glce enzymatic activity in embryos at different developmental stage. At each time point 20 embryos were dechorionated and homogenized. For the enzymatic assay, a cell lysate was incubated (2 h at 28°C) with labeled bacterial K5 heparosan substrate and the 3H2O liberated as result of the epimerization of GlcA into IdoA, measured. The bars represent the mean ± SD of the values from three independent determinations. (c-l) whole-mount in-situ hybridization of glce-a in embryos at different stages of development. (c-j) Top row: lateral views. Bottom row: animal pole views. (c,d) blastoderm at 64 cells stage; (e,f) dome stage; (g,h) shield stage; (i,j) 3 somite stage. (k) 24 hpf embryo showing showing intense glce staining at the perimeter of the forth ventricle as indicated by the arrow-heads. (l) enlargment of the embryo brain forth ventricle area.