
|
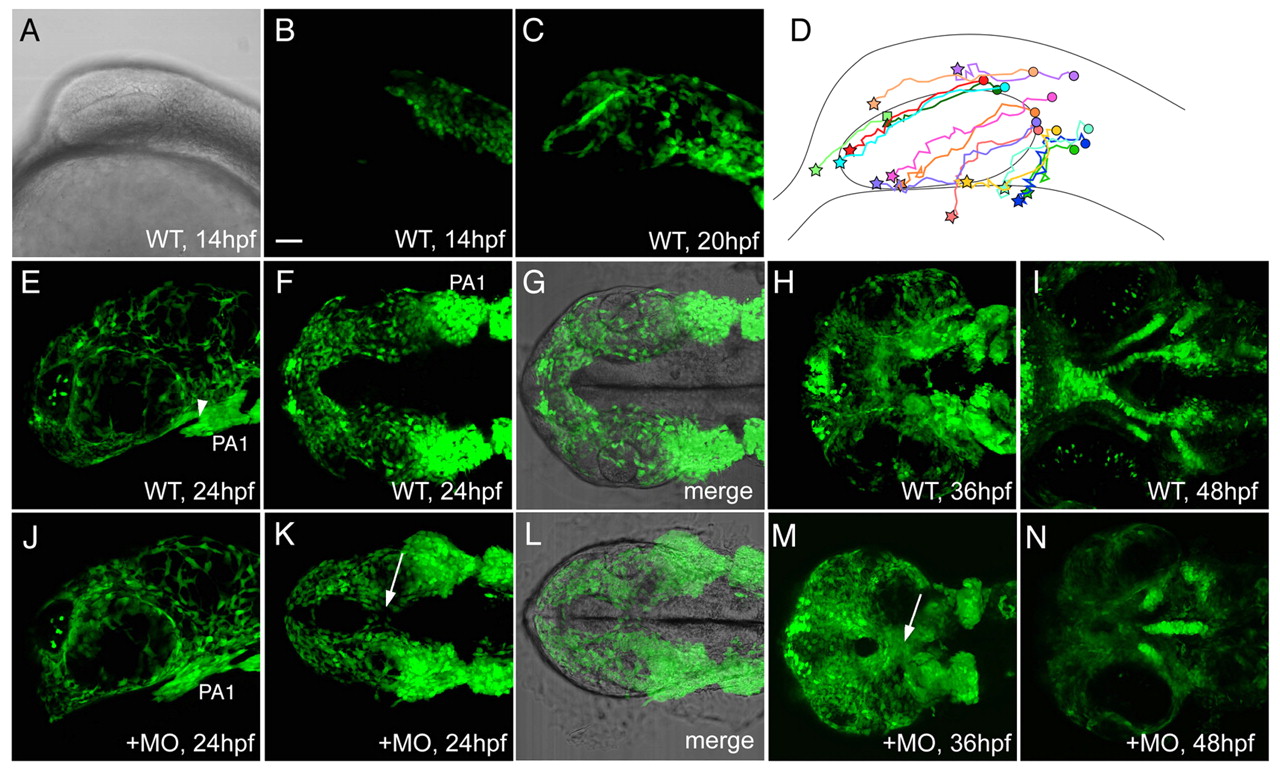
Fig. 3 Expression of the sox10:egfp transgene in cranial NC cells of living embryos. (A-C) Representative images from a confocal, time-lapsed movie of sox10:egfp expression in the head between 14-20 hpf, lateral view (see also Movie 1 in the supplementary material). (A-C) Brightfield (A) and confocal images (B,C) at 14 hpf (A,B) and 20 hpf (C). (D) Diagram illustrating migration paths of individual NC cells, traced by analyzing confocal stacks within the movie. Circles indicate premigratory cell positions and stars indicate their positions six hours later. Some cells (dark green triangle) could not be tracked beyond 17.5 hpf, whereas others (light green square) were only traceable after 16.5 hpf. (E-N) sox10:egfp+ cells at later stages in wild-type (E-I) and Hh-deficient (J-N) embryos. (E) Lateral view at 24 hpf, showing the first pharyngeal arch (PA1) and stomodeum (arrowhead). Precursors of the ANC lie beneath the eye and anterior to this stomodeal pouch. (F,G) Ventral views with (G) and without (F) accompanying brightfield images. (H,I) By 36 hpf, sox10:egfp+ cells aggregate around the mouth (H), and, by 48 hpf, form cartilage of the ANC (I). (J) In Hh-deficient embryos, sox10:egfp expression is similar to that seen in wild-type controls, when viewed laterally. (K,L) However, in ventral view the head is mediolaterally compressed, and NC cells anterior to PA1 fuse across the ventral midline, between the eyes (arrow). (M) Fusion is more pronounced at 36 hpf, forming a single midline condensation (arrow). (N) A single rod of sox10:egfp+ cartilage forms in the midline by 48 hpf. Scale bar: 50 μm.