
|
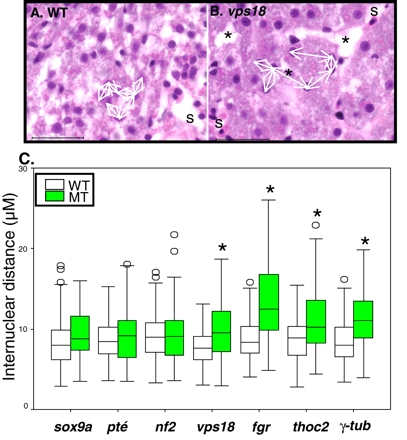
Fig. 2 Four mutants with hepatomegaly have increased internuclear distance. (A,B) The internuclear distance between adjacent hepatocytes (white arrows) illustrated in wild-type (A) and vps18 (B) hepatocytes. Cells separated by sinusoids (s) or large extracellular gaps (*) were excluded. Scale bar: 50 µm. (C) The hepatocyte internuclear distance was measured for wild-type and mutant embryos from each line and plotted in box and whisker plots. The 25th, 50th (median) and 75th percentiles are indicated as the horizontal lines of the box, with the 10th and 90th percentiles shown as cross bars on lines extending from the boxes. Measurements falling outside of the 10th and 90th percent were considered outliers and are shown as open circles. *P<0.001, as determined by Student′s t-test..