
|
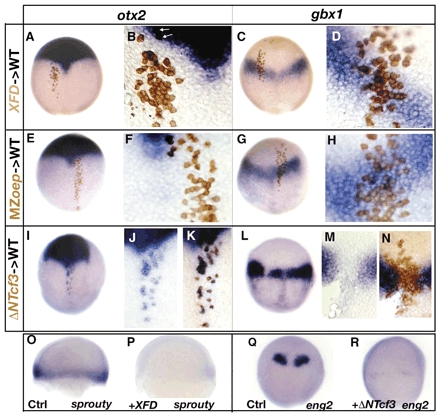
Fig. 3 Role of FGF, Nodal and Wnt signals in defining the otx2 and the gbx1-expression domain. (A-D) Embryo containing cells derived from injected embryos with a lineage tracer (brown) and XFD RNA (200 pg) stained for otx2 (A,B) or for gbx1 expression (C,D) at 90%. (B,D) Close-up of transplanted cells. XFD-transplanted cells (blind for FGF signaling) strictly follow the host otx2 expression domain or gbx1 expression domain. (E-H) Embryos containing cells derived from MZoep-injected embryos with a lineage tracer (brown) stained for otx2 (E,F) or for gbx1 expression (G,H) at 90%. (F,H) Close-up of transplanted cells. MZoep cells (blind for Nodal signaling) strictly follow the host otx2 expression domain or gbx1 expression domain. (I-N) Embryos containing cells derived from injected embryos with a lineage tracer (brown) and ΔNTcf3 RNA (400 pg). (I) Transplanted embryo stained for otx2. (J) Close-up of cells ectopically expressing otx2 followed by (K) staining the donor cells (brown). (L) Transplanted embryo stained for gbx1. (M) Close-up of the gap in the gbx1-expression domain followed by (N) staining the donor cells (brown). The ΔNTcf3-transplanted cells (blind for Wnt signaling) express otx2 ectopically and do not express gbx1. (O) Control embryo at 60% stained for sprouty4; (P) XFD-injected embryos do not express sprouty4, an FGF target gene. (Q) Control embryo at tailbud stained for eng2. (R) In ΔNTcf3-injected embryos, eng2 expression is strongly diminished. (A-R) Dorsal views, anterior upwards.