
|
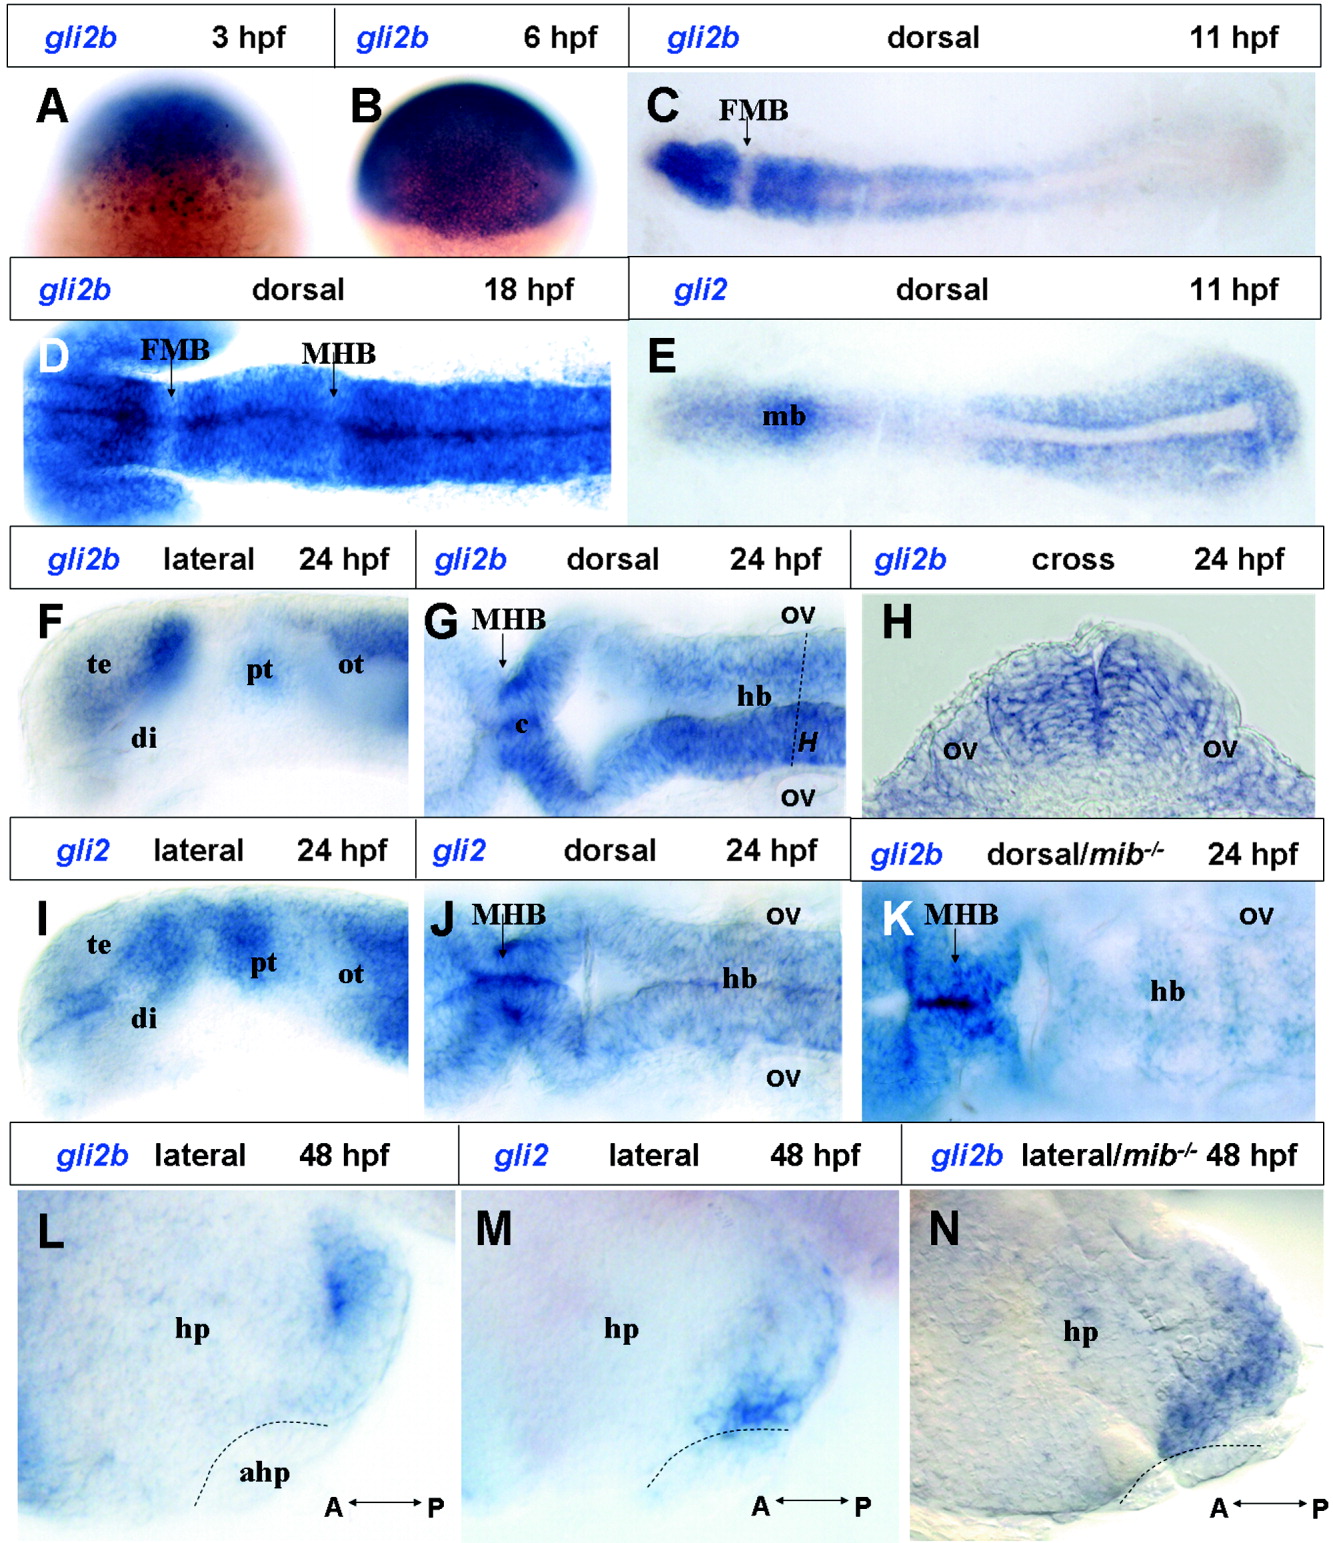
Fig. 3 The spatial pattern of gli2b expression during zebrafish embryogenesis. Whole-mount in situ hybridization was performed as described in the Experimental Procedures section. The stages and views of embryos as well as probes used for in situ hybridization are indicated in each panel. A: A 3 hours postfertilization(hpf) embryo. Note that gli2b mRNA is present mainly in nuclei. B: A 6 hpf embryo. gli2b transcripts are found in the cytoplasm. C,E: Flat mount of three-somite stage embryos hybridized with the gli2b (C) and gli2 (E) probes, respectively. D: Dorsal view of the anterior portion of an 18 hpf embryo hybridized with the gli2b probe. F,G: Lateral (F) and dorsal (G) views of 24 hpf embryos hybridized with the gli2b probe. H: Cross-section of the 24 hpf embryo in G at the otic vesicle level (dash line in G). I,J: Expression of gli2 provided for comparison with F, G. K: A 24 hpf mib-/- embryo hybridized with the gli2b probe. L,M: Expression of gli2b (L) and gli2 (M) mRNA in the ventral diencephalon of 48 hpf embryos. N: Expression of gli2b mRNAs in the ventral diencephalon of 48 hpf mib-/- embryo. L-N: Anterior (A) / posterior (P) axis and adenohypophysis (broken line) of embryo are indicated. ahp, adenohypophysis; di, diencephalon; FMB, forebrain-midbrain boundary; hb, hindbrain; hp, hypothalamus; mb, midbrain; MHB, midbrain-hindbrain boundary; ot, optic tectum; ov, otic vesicle; pt, posterior thalamus; te, telencephalon.