
|
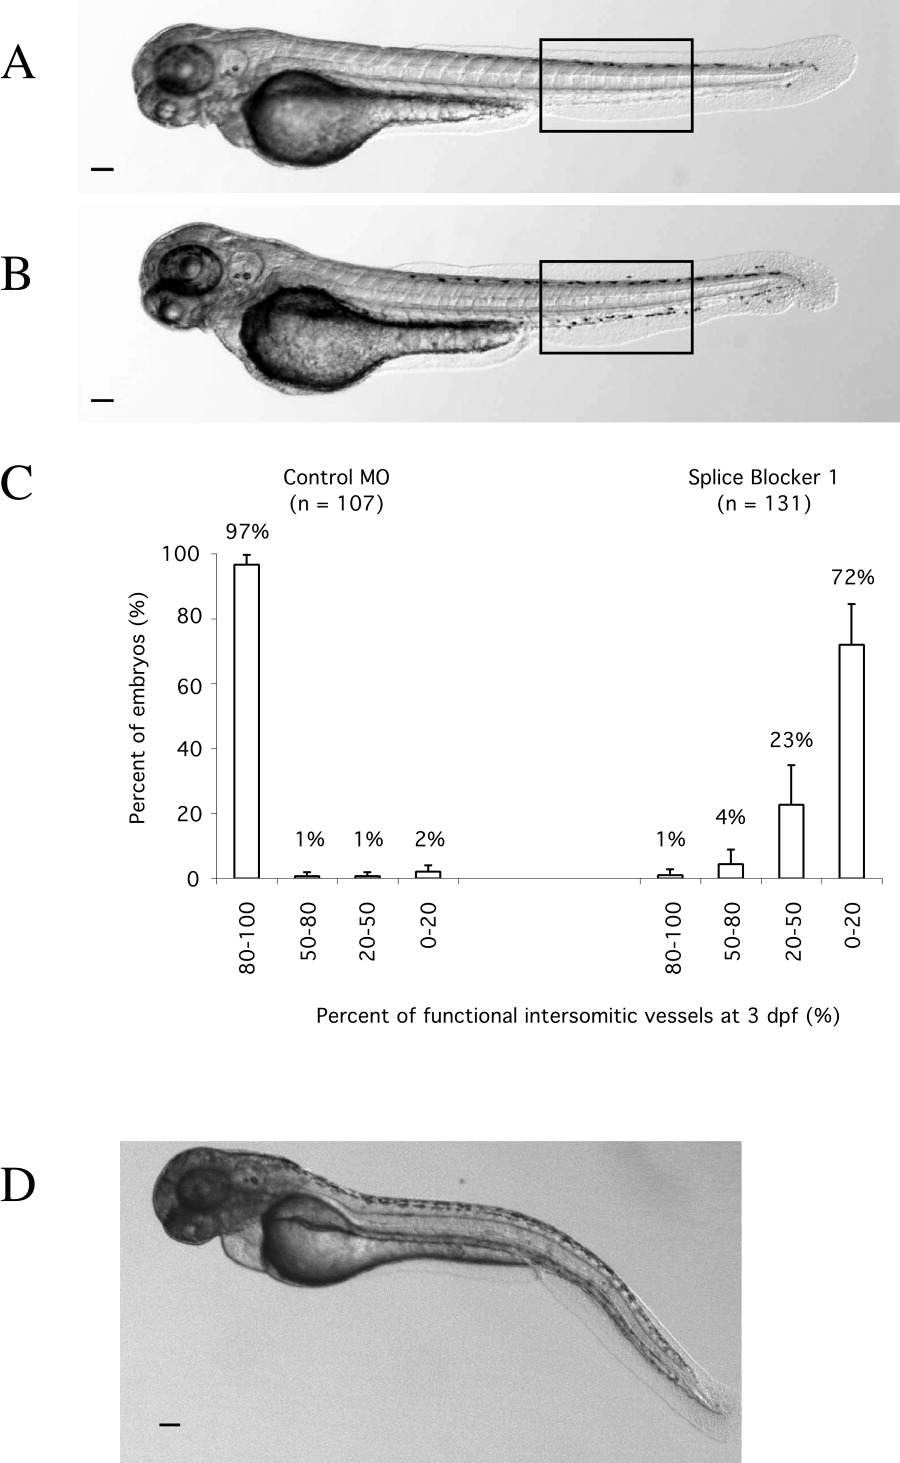
Fig. 7 Effects of morpholino oligonucleotide (MO) in vascular development in zebrafish. A,B: Embryos were injected with 0.8 pmol of either the control MO (A) or splice blocker 1 (B) and examined at 3 dpf. Movie clips of blood circulation (boxed regions) observed under light microscopy were also recorded (see Supplementary Movies 1A and B). C: Histogram showing the distribution of embryos according to percent of functional intersomitic vessels present at 3 days postfertilization (dpf). Amounts of the control MO or splice blocker 1 injected were 1.2 or 0.8 pmol, respectively. Results were the averages of three different experiments. The percentages do not add up to 100% due to rounding errors. D: A 3-day-old embryo injected with splice blocker 1 showing a curvature in the trunk/tail region. Scale bars = 0.1 mm in A,B,D.