
Image
|
Figure Caption
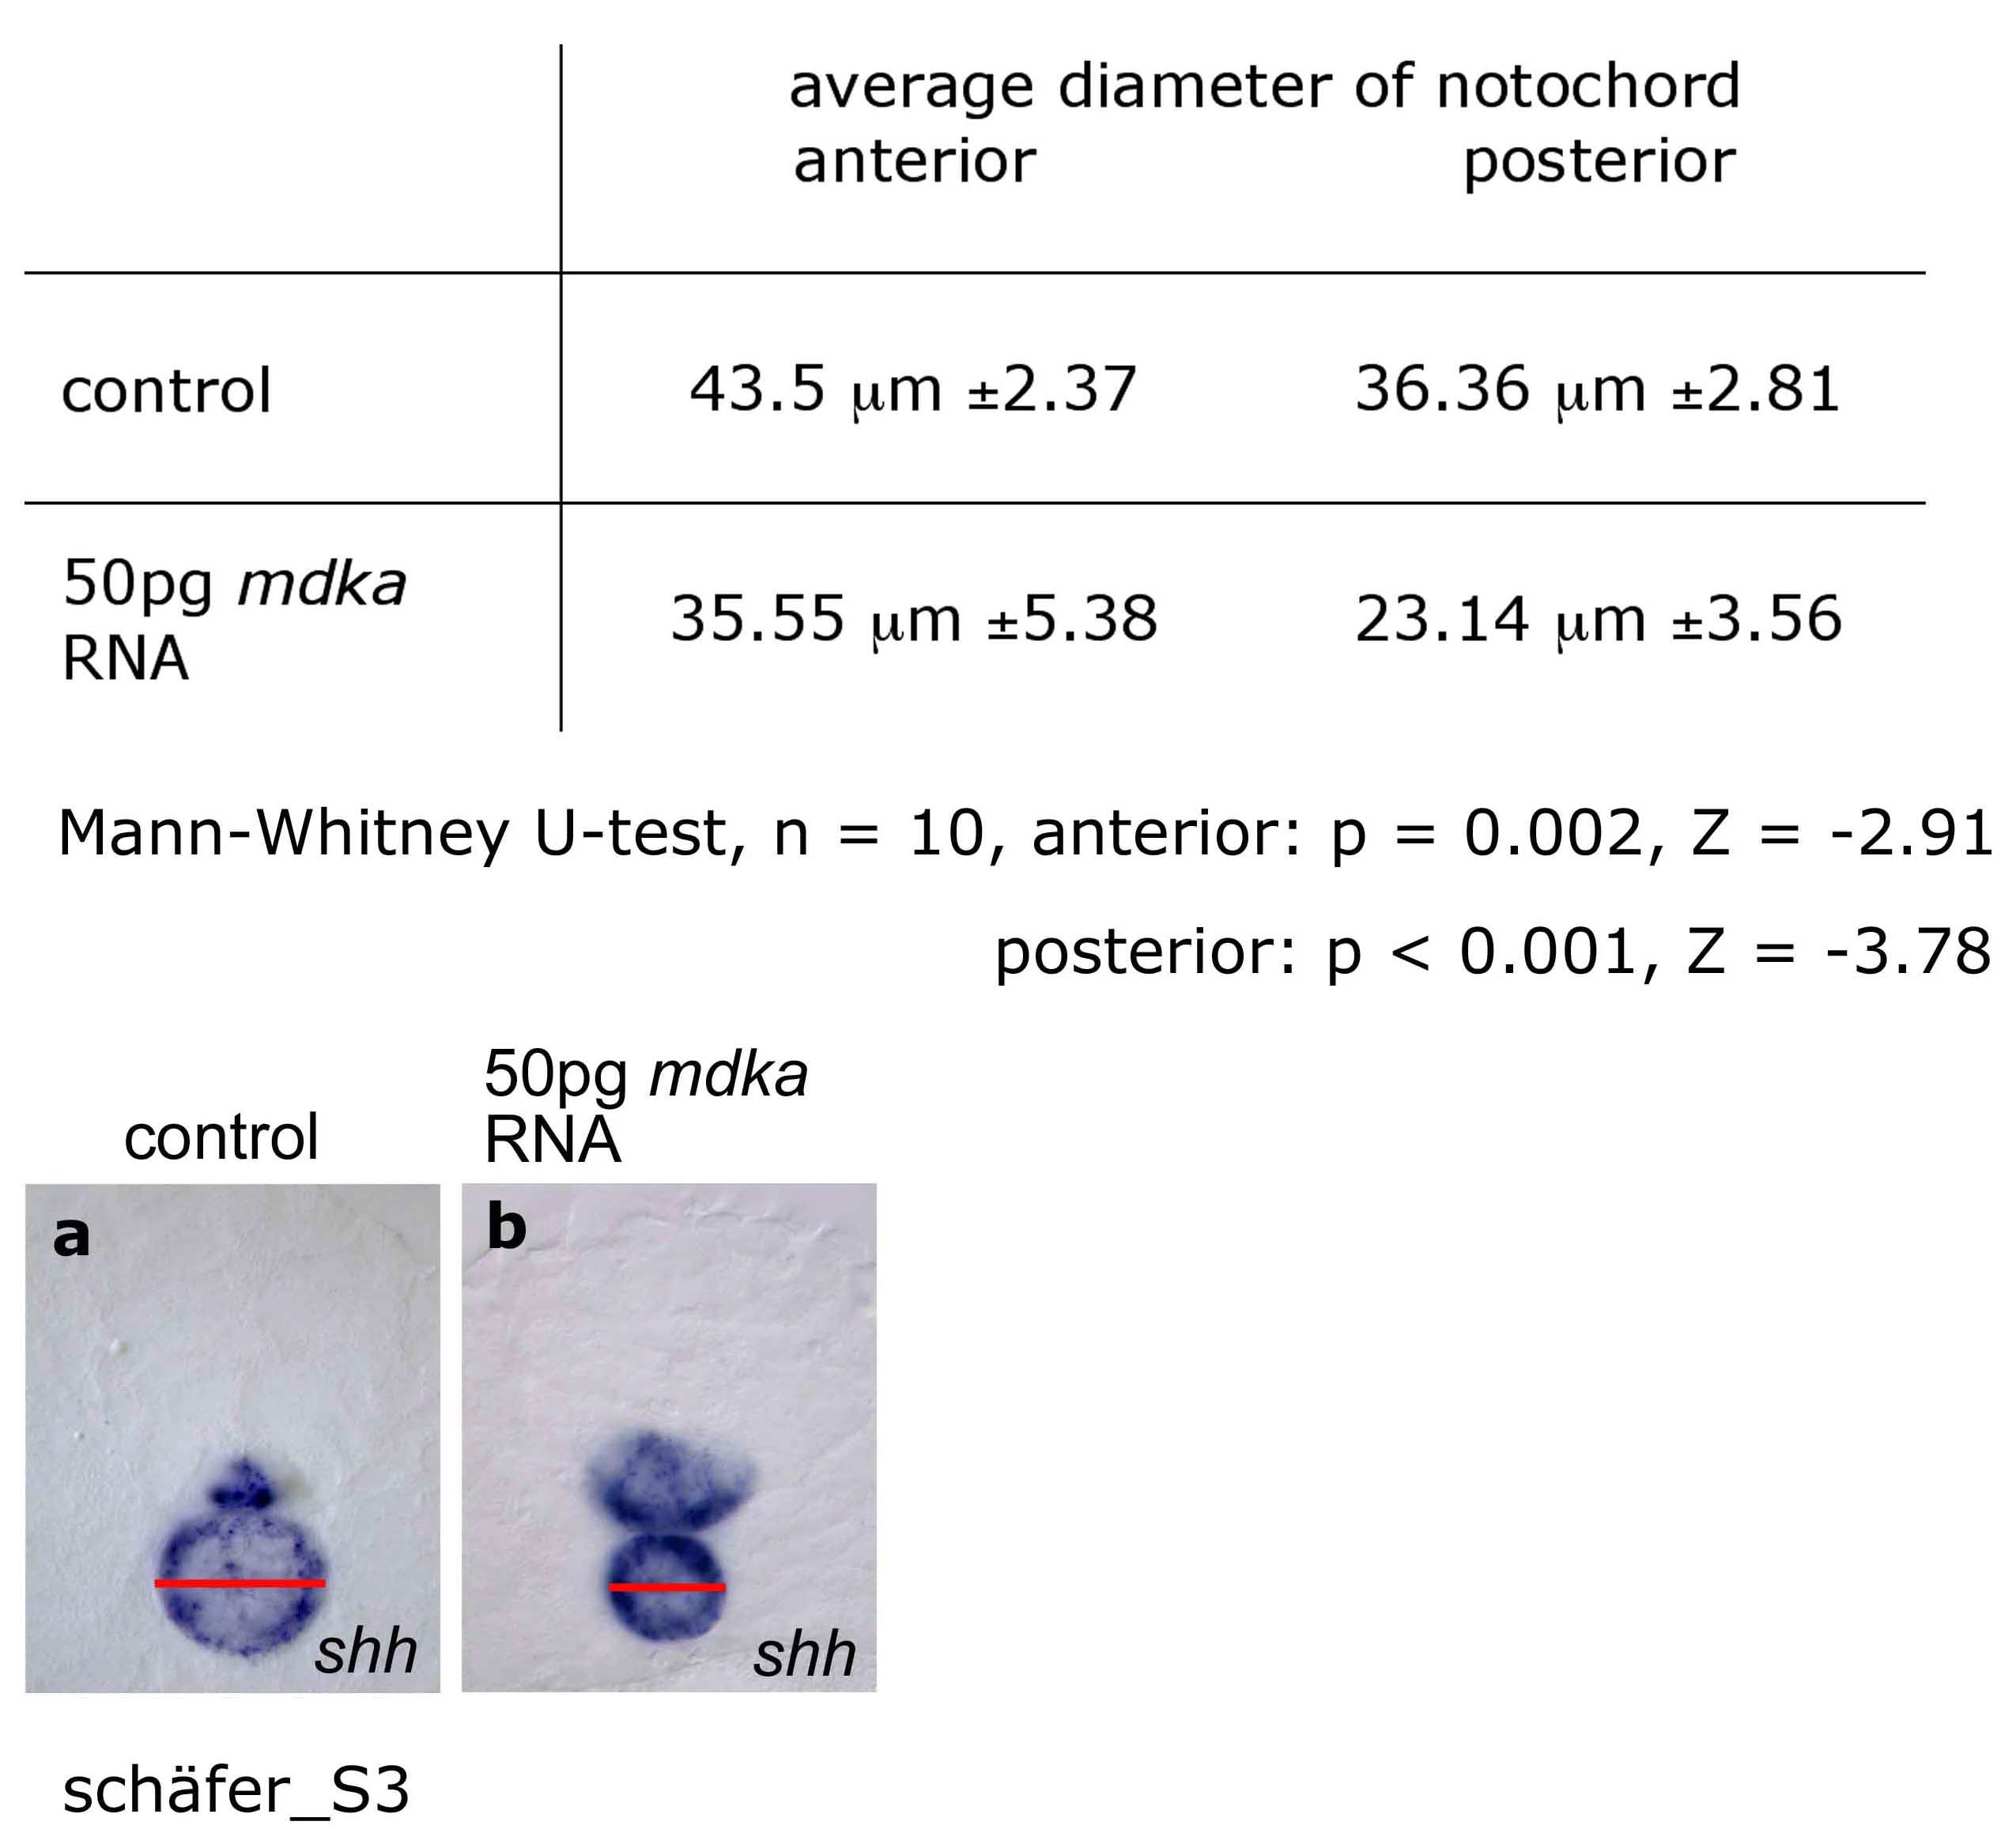
Fig. S3 Effect of mdka overexpression on notochord size. The diameter of the notochord was determined (SIS imaging analysis software) in six transversial sections (three at anterior, three at posterior trunk levels at equivalent positions with respect to somite positions) each of ten control embryos (a) and ten embryos injected with 50pg mdka RNA (b) after staining for shh. A highly significant reduction of notochord diameter was observed in anterior (Mann-Whitney U-test, n = 10, p = 0.002, Z = -2.91) and posterior trunk (Mann-Whitney U-test, n = 10, p < 0.001, Z = -3.779).
Figure Data
Acknowledgments
This image is the copyrighted work of the attributed author or publisher, and
ZFIN has permission only to display this image to its users.
Additional permissions should be obtained from the applicable author or publisher of the image.
Full text @ Genes & Dev.