
|
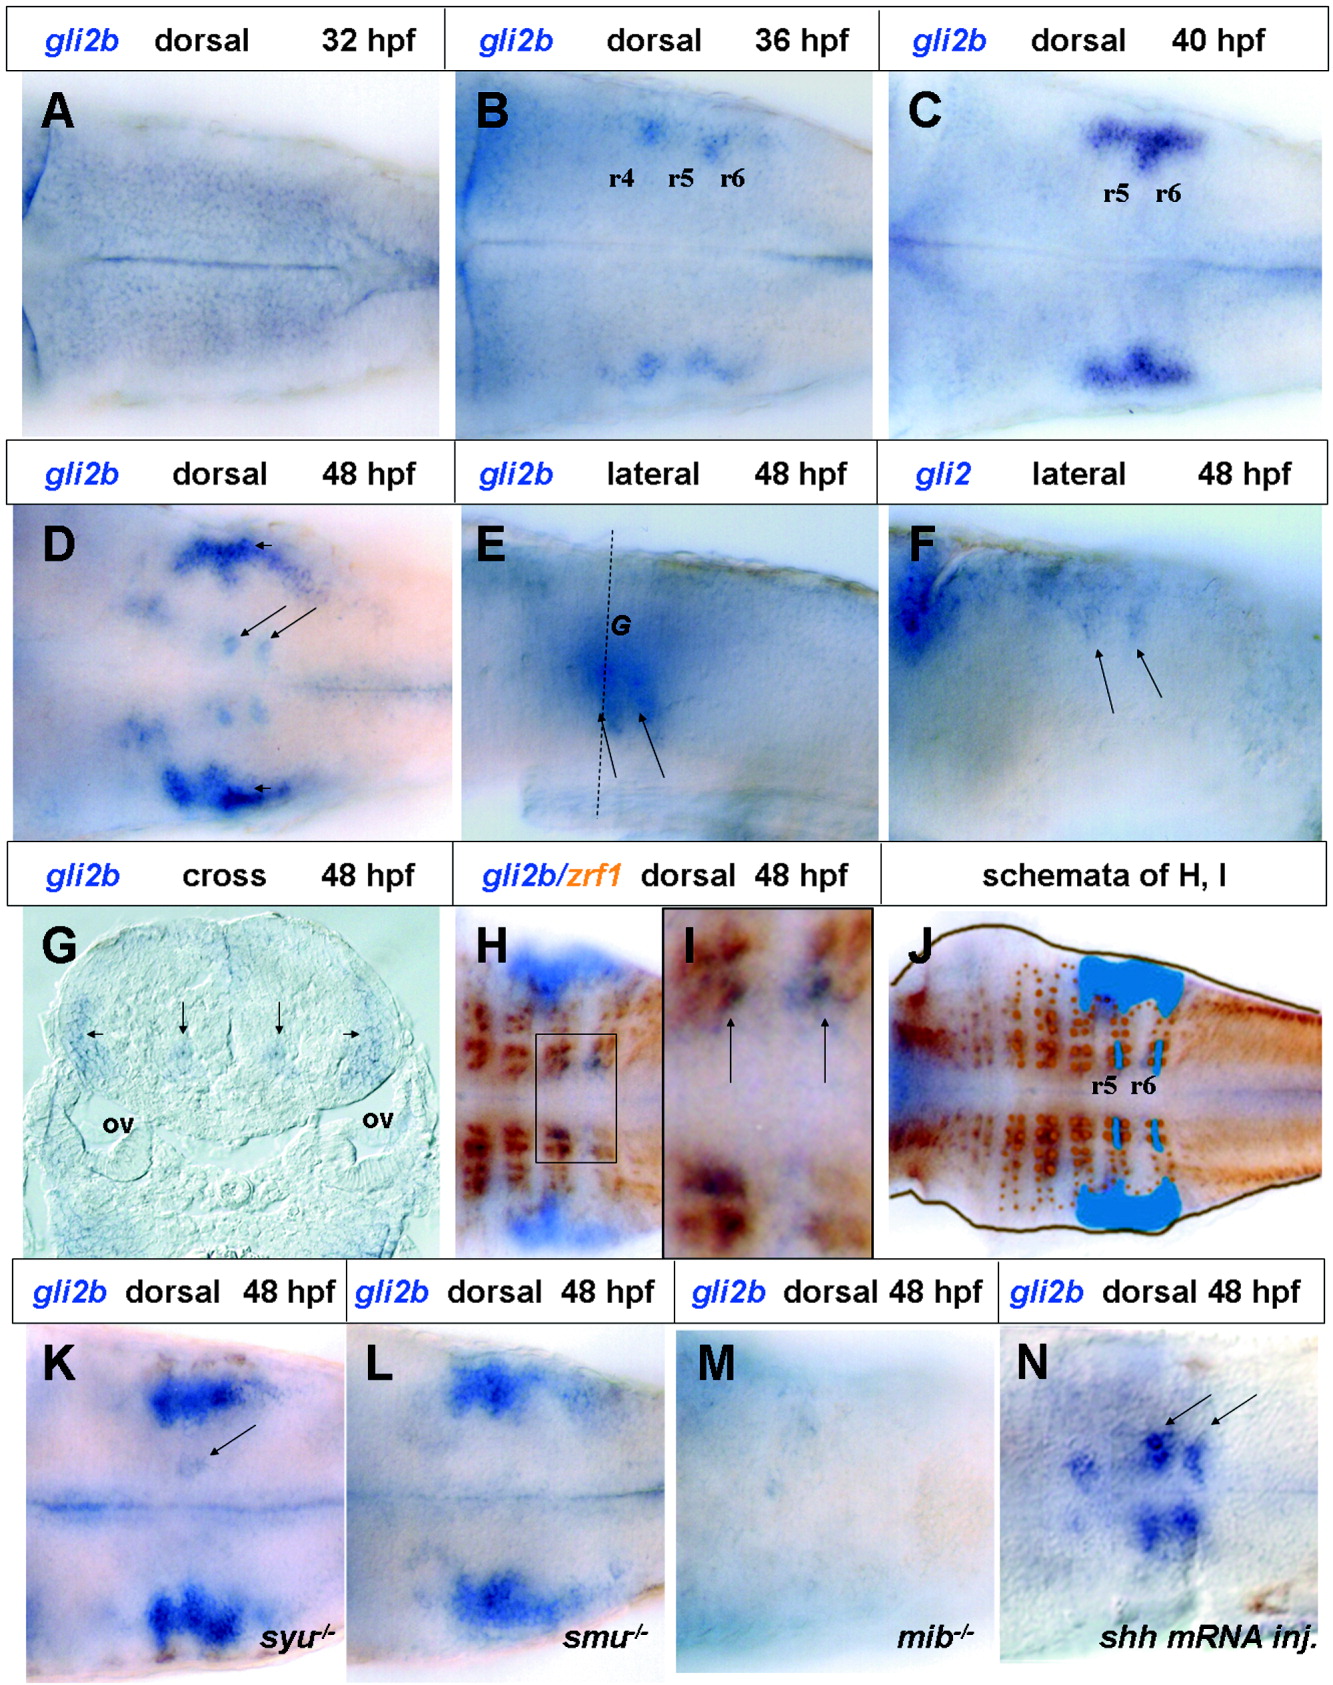
Fig. 4 Analysis of gli2b expression in the hindbrain. A-D: Dorsal view of the temporal change of gli2b expression pattern in rhombomeres 4-6 in the hindbrain region at 32-48 hours postfertilization (hpf). E,F: Lateral view of 48 hpf embryos hybridized with the gli2b (E) and gli2 (F) probes, respectively. G: Cross-section of the 48 hpf embryo at the level indicated by the dash line in E. gli2b mRNA is detected in two clusters in the medial part of the neural tube (arrows) and bilaterally immediately above the otic vesicle (arrowheads). H: Two-color staining of a 48 hpf embryo by using gli2b riboprobe and zrf-1 antibody to demonstrate close association of gli2b-positive domains with the endfeet of radial glia distributed in a checkered manner. I: Enlargement of the region boxed in H. J: Montage of gli2b expression shown in H,I. Expression domain of gli2b was redrawn in blue for clarity. The lateral clusters of gli2b-positive cells projected in between curtains of the radial glia clusters. K-M: gli2b expression in the hindbrain in selected mutant embryos: syu-/- (K), smu-/- (L), and mib-/- (M). N: gli2b expression in a shh mRNA-injected embryos (48 hpf). ov, otic vesicle; r4-r6. rhombomere4-6.