
Fig. 4
|
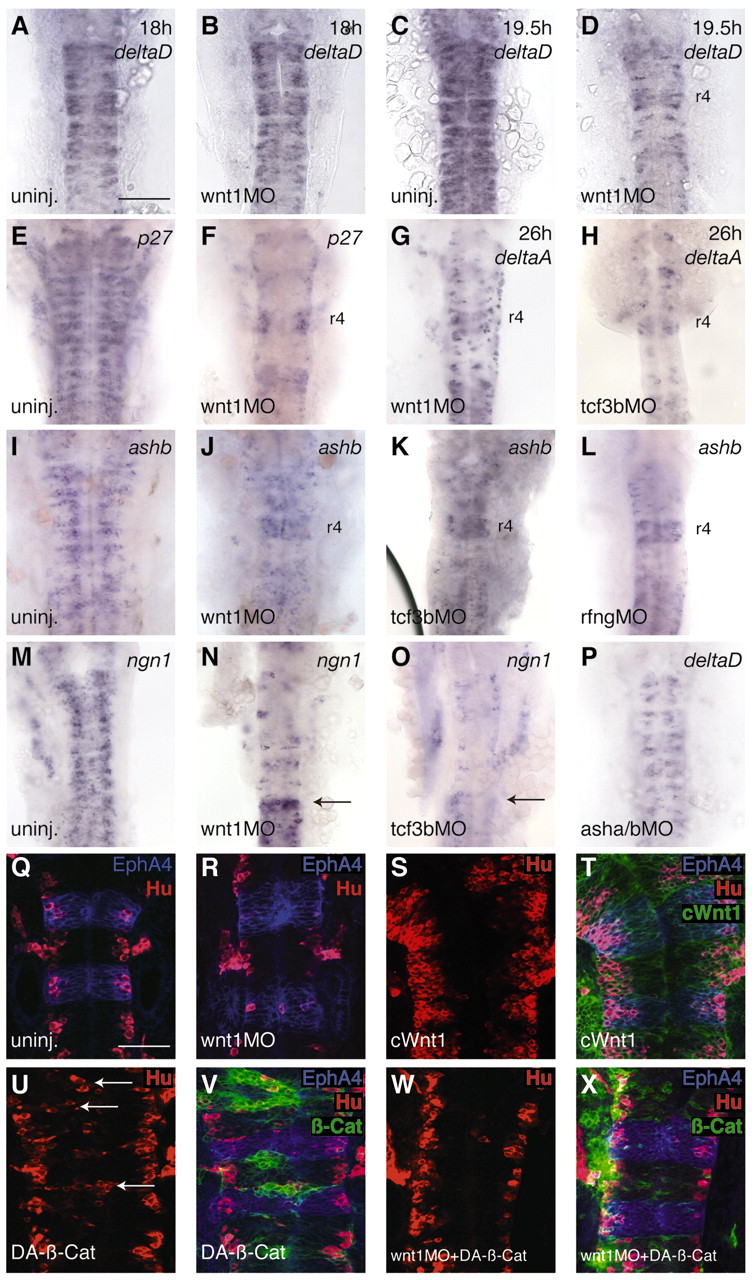
Fig. 4 Regulation of neurogenesis in the hindbrain by Wnt signalling. In situ hybridisation or immunocytochemistry was carried out to detect expression of probe/antigen, as indicated at the top right of each panel. (A-D) Time-course of the effect of wnt1 knockdown on deltaD expression; no effect is observed at 18 hours, whereas expression is much reduced at 19.5 hours (8/10 embryos). (E,F) Neurogenesis is reduced in wnt1 MO-injected embryos at 24 hours, as seen by detecting p27xic1-a (p27) expression (20/20 embryos). (G-P) Knockdown of wnt1 (82/86 embryos), tcf3b (50/55 embryos) and rfng (28/37 embryos) all cause downregulation of delta and proneural gene expression at 24 hours. A greater decrease in deltaA expression occurs following knockdown of tcf3b than wnt1 (compare G and H). Notably, neurogenesis is less affected by these knockdowns in r4 (F-H,J-L,N,O), r7 and the spinal cord (arrows in N and O indicate the r6/r7 boundary). (P) Double asha/ashb knockdown decreases deltaD expression. Note that in knockdowns that disrupt neurogenesis, the hindbrain does not broaden and appears to be at an earlier morphological stage due to decreased cell proliferation and major depletion of the mantle zone of postmitotic neurons. (Q-X) Activating Wnt signalling causes ectopic neurogenesis. Hu expression in uninjected (Q), wnt MO injected (R), cWnt1 injected (S,T), stabilised ß-catenin injected (U,V) or double wnt MO and ß-catenin injected embryos (W,X). In T, V and X, expressing cells are green (co-injection of GFP), and r3 and r5 are blue (EphA4). Embryos overexpressing Wnt1 have more neurons than uninjected embryos (compare Q and S). ß-Catenin can cause ectopic neuronal differentiation in expressing cells in uninjected embryos (arrows in U point to ectopic Hu-positive cells that express ß-catenin in V), and in wnt1 MO embryos (compare left and right sides in W; more neurons are present on the left, where most ß-catenin expressing cells are present, X). Scale bars: in A, 100 µm for A-P; in Q, 50 µm for Q-X