
|
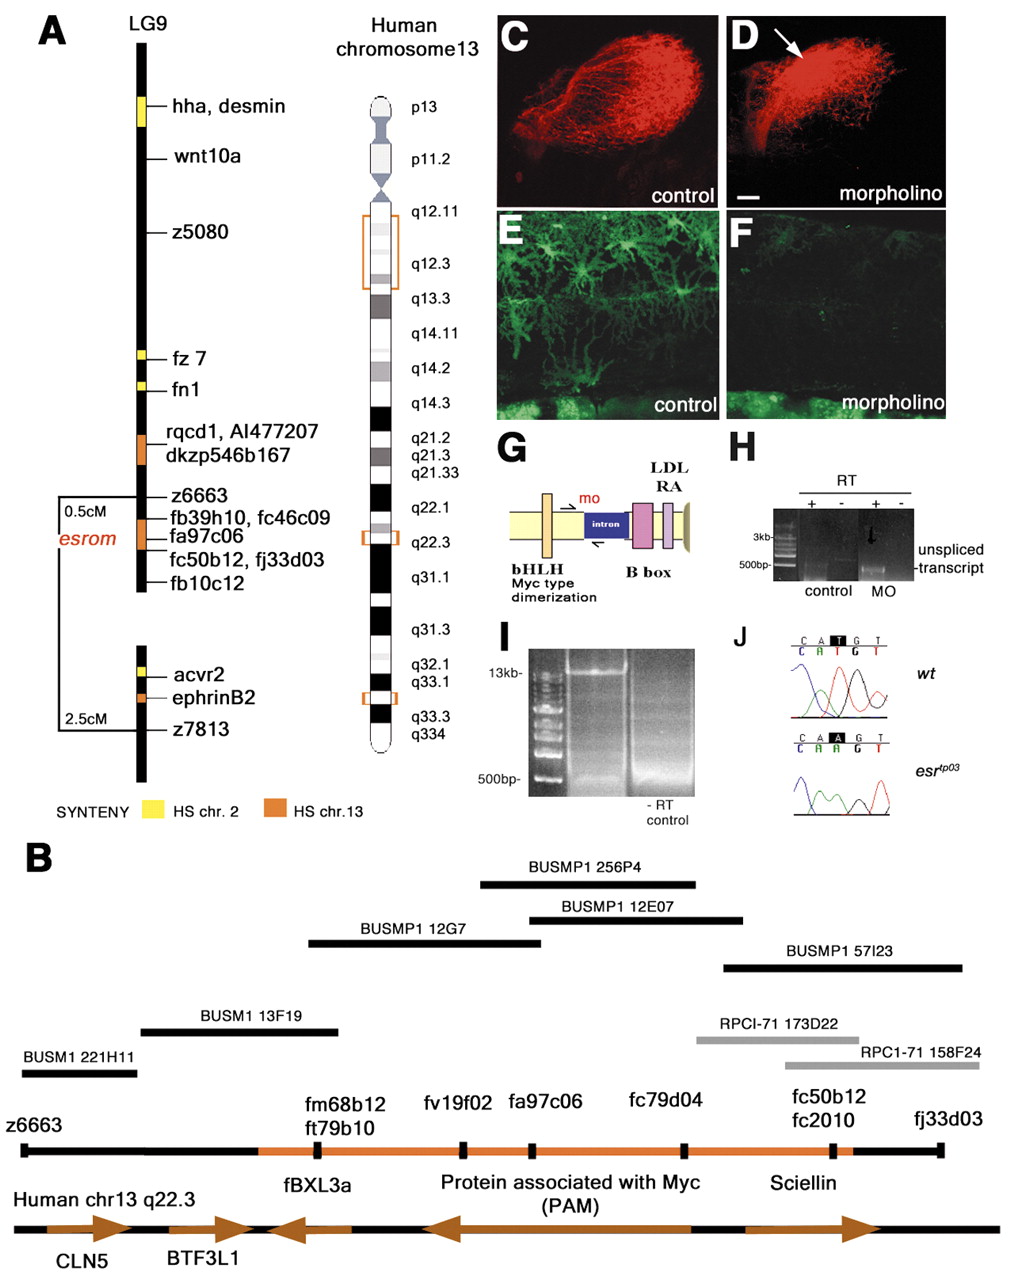
Fig. 3 Positional cloning of esrom. (A) Map of zebrafish chromosome 9, depicting the region to which esrom maps and its synteny to human chromosome 13 (orange). Yellow color indicates synteny to human chromosome 2. (B) Genomic contig assembly of zebrafish PAC and BAC clones encompassing esrom and its similarity to human chromosome 13q22.3. esr maps 0.5 cM from z6663, 0.2 cM from fj33d03 and less than 0.08 cM from fa97c06. (C,D) Retinotectal projections of DiI-labeled anterior RGC axons in 4-day-old wild-type embryos injected with control morpholino and zebrafish PAM morpholino. (C) In the control, anterior RGC axons branch in the posterior tectum as in wild types. (D) In zebrafish, PAM morphants anterior RGC axons branch prematurely in the anterior tectum (arrow). (E,F) Lateral view of 3-day-old larvae. Xanthophore phenotype in morphants mimics that of mutants (Le Guyader et al., 2004). (G) Splice site target of zebrafish PAM morpholino2. (H) RT-PCR of 400 bp unspliced transcript in control and morphants. The unspliced band is amplified only in the zebrafish PAM morphants. (I) Single cDNA band (13 kb) from RT-PCR using esrom specific primers. (J) Point mutation in esrtp03. Scale bar: 25 µm.