
FIGURE
Fig.s1091t
- ID
- ZDB-FIG-090326-77
- Publication
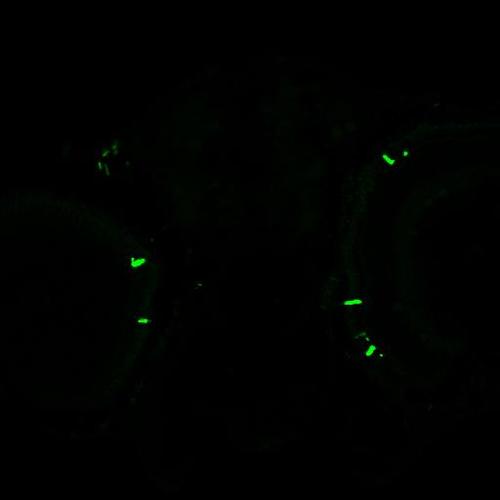
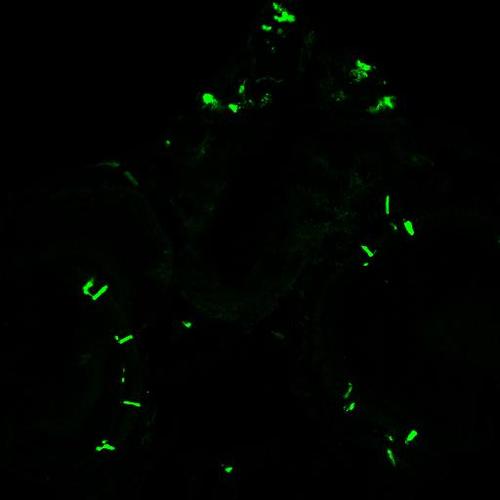
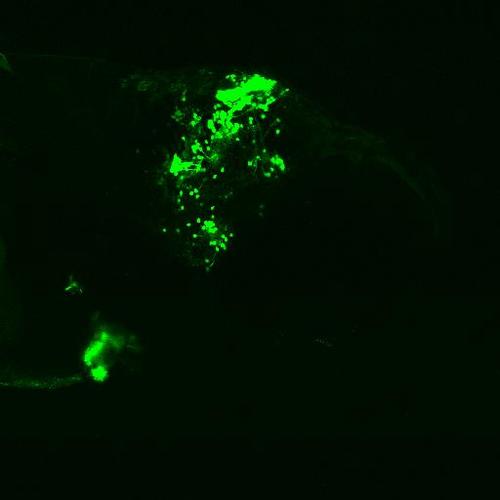
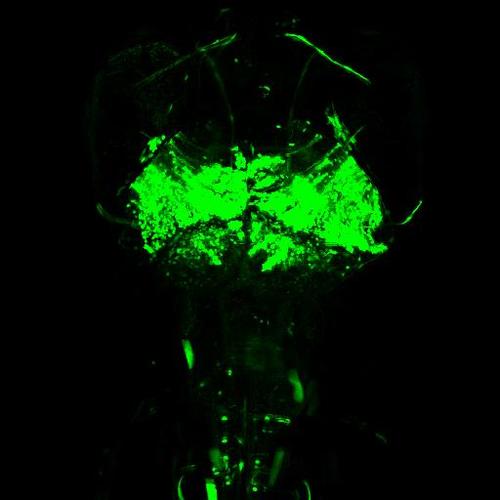
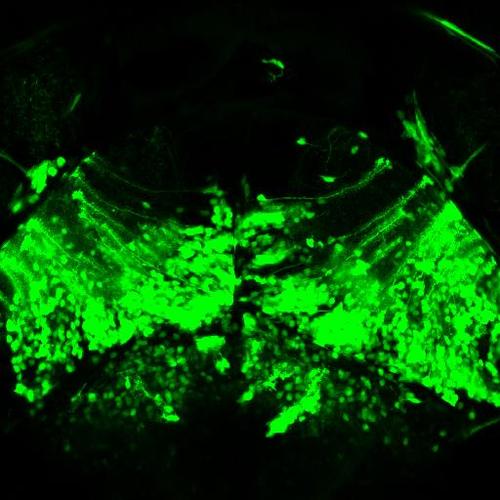
- Mason et al., 2009 - Expression patterns from GAL4 enhancer trap screen
Fig.s1091t
|
Expression: subset of tectum (caudal and midline)- cell bodies and glia, few cell bodies in HB 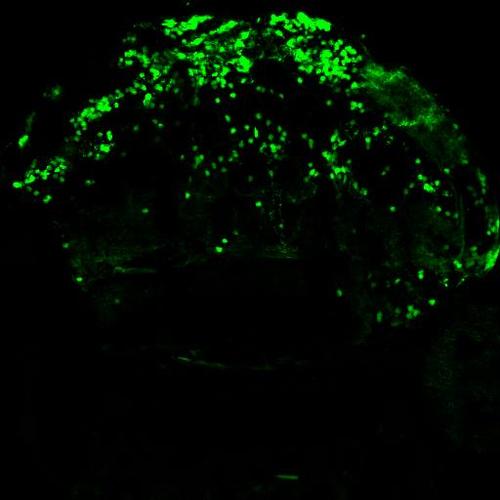
|
Expression Data
| Gene: | |
|---|---|
| Fish: | |
| Anatomical Term: | |
| Stage Range: | Bud to Days 7-13 |
Expression Detail
Antibody Labeling
Phenotype Data
Phenotype Detail
Acknowledgments
This image is the copyrighted work of the attributed author or publisher, and
ZFIN has permission only to display this image to its users.
Additional permissions should be obtained from the applicable author or publisher of the image.