
FIGURE
Fig.s1053t
- ID
- ZDB-FIG-090326-48
- Publication
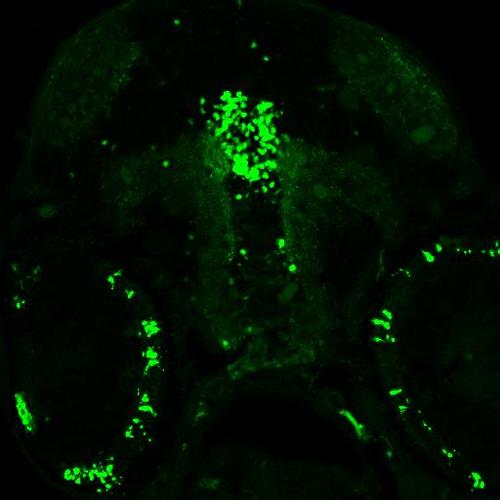
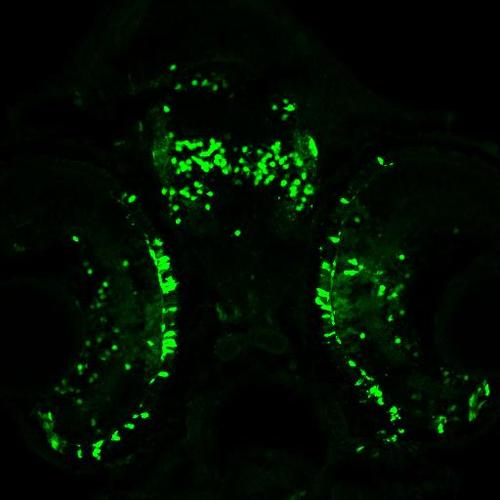
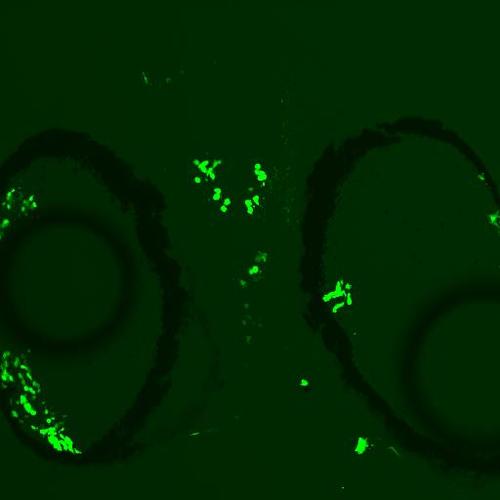
- Mason et al., 2009 - Expression patterns from GAL4 enhancer trap screen
Fig.s1053t
|
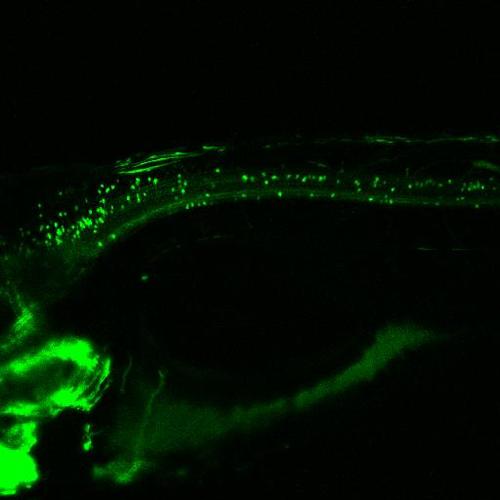
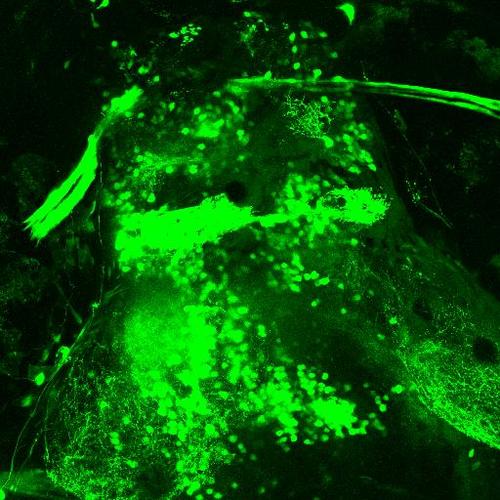
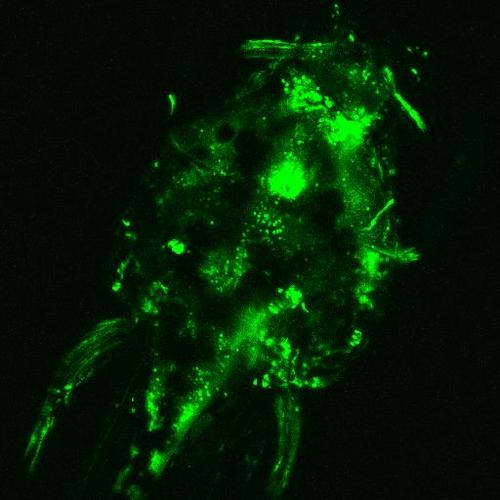
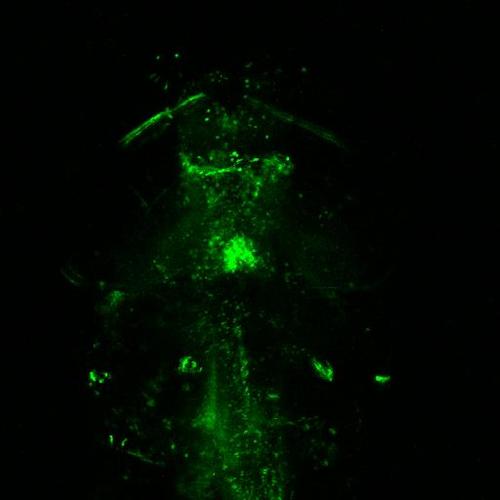
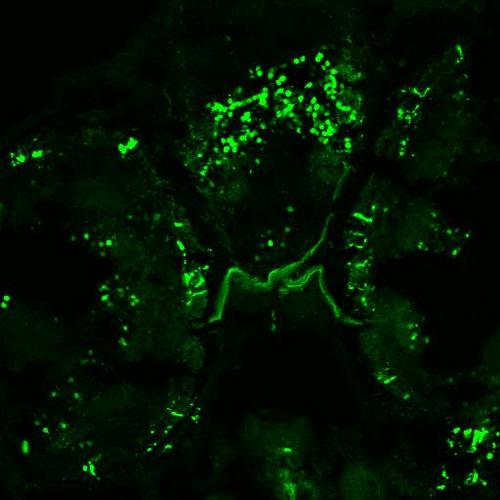
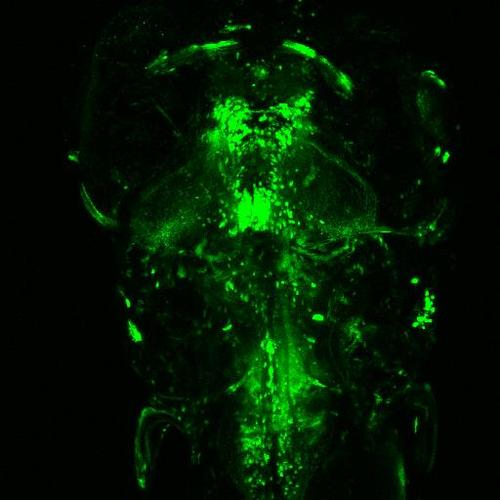
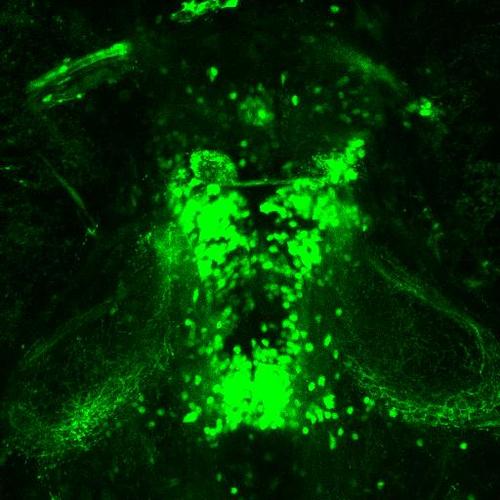
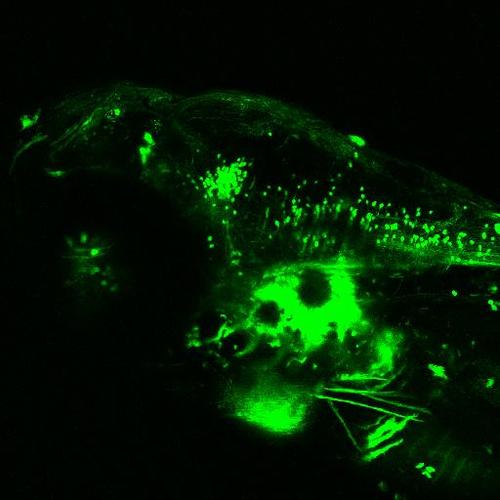
Expression: eye: few PRCs (esp ventral), few RGCs, ON; distinct cell bodies in hindbrain, patch of cell bodies in midbrain (centered on DV axis), 2 mirrored dots on dorsal surface at start of tail - on inner dorsal ear?, 2 mirrored dots in hindbrain (just posterior to midbrain) on dorsal surface and spaced far apart laterally - on inner ear?, parallel clusters of cell bodies between eyes in midbrain, 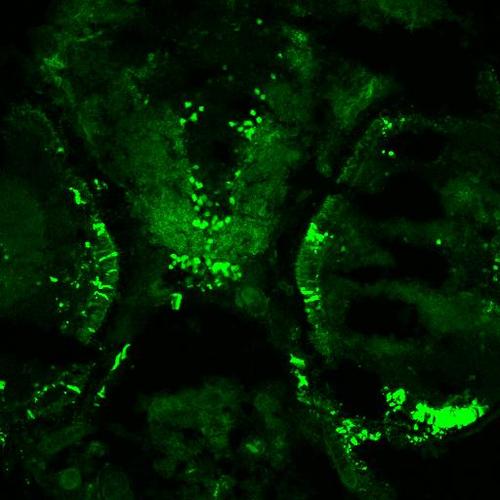

|
Expression Data
| Gene: | |
|---|---|
| Fish: | |
| Anatomical Term: | |
| Stage Range: | Bud to Days 7-13 |
Expression Detail
Antibody Labeling
Phenotype Data
Phenotype Detail
Acknowledgments
This image is the copyrighted work of the attributed author or publisher, and
ZFIN has permission only to display this image to its users.
Additional permissions should be obtained from the applicable author or publisher of the image.