
FIGURE
Fig. 4
- ID
- ZDB-FIG-080327-229
- Publication
- Thisse et al., 2008 - Embryonic and Larval Expression Patterns from a Large Scale Screening for Novel Low Affinity Extracellular Protein Interactions
- Other Figures
-
- Fig. 1
- Fig. 1
- Fig. 1
- Fig. 1
- Fig. 1
- Fig. 1
- Fig. 1
- Fig. 1
- Fig. 1
- Fig. 1
- Fig. 1
- Fig. 1
- Fig. 1
- Fig. 1
- Fig. 1
- Fig. 1
- Fig. 1
- Fig. 1
- Fig. 1
- Fig. 1
- Fig. 1
- Fig. 1
- Fig. 1
- Fig. 1
- Fig. 1
- Fig. 1
- Fig. 1
- Fig. 1
- Fig. 1
- Fig. 1
- Fig. 1
- Fig. 1
- Fig. 1
- Fig. 1
- Fig. 1
- Fig. 1
- Fig. 1
- Fig. 1
- Fig. 1
- Fig. 1
- Fig. 1
- Fig. 1
- Fig. 1
- Fig. 1
- Fig. 1
- Fig. 1
- Fig. 1
- Fig. 1
- Fig. 1
- Fig. 1
- Fig. 1
- Fig. 1
- Fig. 1
- Fig. 1
- Fig. 1
- Fig. 1
- Fig. 1
- Fig. 1
- Fig. 1
- Fig. 1
- Fig. 1
- Fig. 1
- Fig. 1
- Fig. 1
- Fig. 1
- Fig. 1
- Fig. 1
- Fig. 1
- Fig. 1
- Fig. 1
- Fig. 1
- Fig. 1
- Fig. 1
- Fig. 1
- Fig. 1
- Fig. 1
- Fig. 1
- Fig. 1
- Fig. 1
- Fig. 1
- Fig. 1
- Fig. 1
- Fig. 1
- Fig. 1
- Fig. 1
- Fig. 1
- Fig. 1
- Fig. 1
- Fig. 1
- Fig. 1
- Fig. 1
- Fig. 1
- Fig. 1
- Fig. 1
- Fig. 1
- Fig. 1
- Fig. 1
- Fig. 1
- Fig. 1
- Fig. 1
- Fig. 1
- Fig. 1
- Fig. 1
- Fig. 1
- Fig. 1
- Fig. 1
- Fig. 1
- Fig. 1
- Fig. 1
- Fig. 1
- Fig. 1
- Fig. 1
- Fig. 1
- Fig. 1
- Fig. 1
- Fig. 1
- Fig. 1
- Fig. 1
- Fig. 1
- Fig. 1
- Fig. 1
- Fig. 1
- Fig. 1
- Fig. 1
- Fig. 1
- Fig. 1
- Fig. 1
- Fig. 1
- Fig. 1
- Fig. 1
- Fig. 1
- Fig. 1
- Fig. 1
- Fig. 1
- Fig. 1
- Fig. 1
- Fig. 1
- Fig. 1
- Fig. 1
- Fig. 1
- Fig. 1
- Fig. 1
- Fig. 1
- Fig. 1
- Fig. 1
- Fig. 1
- Fig. 1
- Fig. 1
- Fig. 1
- Fig. 1
- Fig. 1
- Fig. 1
- Fig. 1
- Fig. 1
- Fig. 1
- Fig. 1
- Fig. 1
- Fig. 1
- Fig. 1
- Fig. 2
- Fig. 2
- Fig. 2
- Fig. 2
- Fig. 2
- Fig. 2
- Fig. 2
- Fig. 2
- Fig. 2
- Fig. 2
- Fig. 2
- Fig. 2
- Fig. 2
- Fig. 2
- Fig. 2
- Fig. 2
- Fig. 2
- Fig. 2
- Fig. 2
- Fig. 2
- Fig. 2
- Fig. 2
- Fig. 2
- Fig. 2
- Fig. 2
- Fig. 2
- Fig. 2
- Fig. 2
- Fig. 2
- Fig. 2
- Fig. 2
- Fig. 2
- Fig. 2
- Fig. 2
- Fig. 2
- Fig. 2
- Fig. 2
- Fig. 2
- Fig. 2
- Fig. 2
- Fig. 2
- Fig. 2
- Fig. 2
- Fig. 2
- Fig. 2
- Fig. 2
- Fig. 2
- Fig. 2
- Fig. 2
- Fig. 2
- Fig. 2
- Fig. 2
- Fig. 2
- Fig. 2
- Fig. 2
- Fig. 2
- Fig. 2
- Fig. 2
- Fig. 2
- Fig. 2
- Fig. 2
- Fig. 2
- Fig. 2
- Fig. 2
- Fig. 2
- Fig. 2
- Fig. 2
- Fig. 2
- Fig. 2
- Fig. 2
- Fig. 2
- Fig. 2
- Fig. 2
- Fig. 2
- Fig. 2
- Fig. 2
- Fig. 2
- Fig. 2
- Fig. 2
- Fig. 2
- Fig. 2
- Fig. 2
- Fig. 2
- Fig. 2
- Fig. 2
- Fig. 2
- Fig. 2
- Fig. 2
- Fig. 2
- Fig. 2
- Fig. 2
- Fig. 2
- Fig. 2
- Fig. 2
- Fig. 2
- Fig. 3
- Fig. 3
- Fig. 3
- Fig. 3
- Fig. 3
- Fig. 3
- Fig. 3
- Fig. 3
- Fig. 3
- Fig. 3
- Fig. 3
- Fig. 3
- Fig. 3
- Fig. 3
- Fig. 3
- Fig. 3
- Fig. 3
- Fig. 3
- Fig. 3
- Fig. 3
- Fig. 3
- Fig. 3
- Fig. 3
- Fig. 3
- Fig. 3
- Fig. 3
- Fig. 3
- Fig. 3
- Fig. 3
- Fig. 3
- Fig. 3
- Fig. 3
- Fig. 3
- Fig. 3
- Fig. 3
- Fig. 3
- Fig. 3
- Fig. 3
- Fig. 3
- Fig. 3
- Fig. 3
- Fig. 3
- Fig. 3
- Fig. 3
- Fig. 3
- Fig. 3
- Fig. 3
- Fig. 3
- Fig. 3
- Fig. 3
- Fig. 3
- Fig. 3
- Fig. 3
- Fig. 3
- Fig. 3
- Fig. 3
- Fig. 3
- Fig. 3
- Fig. 3
- Fig. 3
- Fig. 3
- Fig. 3
- Fig. 3
- Fig. 3
- Fig. 3
- Fig. 3
- Fig. 3
- Fig. 3
- Fig. 3
- Fig. 3
- Fig. 3
- Fig. 3
- Fig. 3
- Fig. 3
- Fig. 3
- Fig. 3
- Fig. 3
- Fig. 3
- Fig. 3
- Fig. 3
- Fig. 3
- Fig. 3
- Fig. 3
- Fig. 3
- Fig. 3
- Fig. 3
- Fig. 3
- Fig. 3
- Fig. 3
- Fig. 3
- Fig. 3
- Fig. 3
- Fig. 3
- Fig. 3
- Fig. 3
- Fig. 4
- Fig. 4
- Fig. 4
- Fig. 4
- Fig. 4
- Fig. 4
- Fig. 4
- Fig. 4
- Fig. 4
- Fig. 4
- Fig. 4
- Fig. 4
- Fig. 4
- Fig. 4
- Fig. 4
- Fig. 4
- Fig. 4
- Fig. 4
- Fig. 4
- Fig. 4
- Fig. 4
- Fig. 4
- Fig. 4
- Fig. 4
- Fig. 4
- Fig. 4
- Fig. 4
- Fig. 4
- Fig. 4
- Fig. 4
- Fig. 4
- Fig. 4
- Fig. 4
- Fig. 4
- Fig. 4
- Fig. 4
- Fig. 4
- Fig. 4
- Fig. 4
- Fig. 4
- Fig. 4
- Fig. 4
- Fig. 4
- Fig. 4
- Fig. 4
- Fig. 4
- Fig. 4
- Fig. 4
- Fig. 4
- Fig. 4
- Fig. 4
- Fig. 4
- Fig. 4
- Fig. 4
- Fig. 4
- Fig. 4
- Fig. 4
- Fig. 4
- Fig. 4
- Fig. 4
- Fig. 4
- Fig. 4
- Fig. 4
- Fig. 4
- Fig. 4
- Fig. 4
- Fig. 4
- Fig. 4
- Fig. 4
- Fig. 4
- Fig. 4
- Fig. 4
- Fig. 4
- Fig. 4
- Fig. 4
- Fig. 4
- Fig. 4
- Fig. 4
- Fig. 4
- Fig. 4
- Fig. 4
- Fig. 4
- Fig. 4
- Fig. 4
- Fig. 4
- Fig. 4
- Fig. 4
- Fig. 4
- Fig. 4
- Fig. 4
- Fig. 4
- Fig. 4
- Fig. 4
- Fig. 4
- Fig. 4
- Fig. 5
- Fig. 5
- Fig. 5
- Fig. 5
- Fig. 5
- Fig. 5
- Fig. 5
- Fig. 5
- Fig. 5
- Fig. 5
- Fig. 5
- Fig. 5
- Fig. 5
- Fig. 5
- Fig. 5
- Fig. 5
- Fig. 5
- Fig. 5
- Fig. 5
- Fig. 5
- Fig. 5
- Fig. 5
- Fig. 5
- Fig. 5
- Fig. 5
- Fig. 5
- Fig. 5
- Fig. 5
- Fig. 5
- Fig. 5
- Fig. 5
- Fig. 5
- Fig. 5
- Fig. 5
- Fig. 5
- Fig. 5
- Fig. 5
- Fig. 5
- Fig. 5
- Fig. 5
- Fig. 5
- Fig. 5
- Fig. 5
- Fig. 5
- Fig. 5
- Fig. 5
- Fig. 5
- Fig. 5
- Fig. 5
- Fig. 5
- Fig. 5
- Fig. 5
- Fig. 5
- Fig. 5
- Fig. 5
- Fig. 5
- Fig. 5
- Fig. 5
- Fig. 5
- Fig. 5
- Fig. 5
- Fig. 5
- Fig. 5
- Fig. 5
- Fig. 5
- Fig. 5
- Fig. 5
- Fig. 5
- Fig. 5
- Fig. 5
- Fig. 5
- Fig. 5
- Fig. 5
- Fig. 5
- Fig. 5
- Fig. 5
- Fig. 5
- Fig. 5
- Fig. 5
- Fig. 5
- Fig. 5
- Fig. 5
- Fig. 5
- Fig. 5
- Fig. 5
- Fig. 5
- Fig. 5
- Fig. 5
- Fig. 5
- Fig. 5
- Fig. 5
- Fig. 5
- Fig. 5
- Fig. 5
- Fig. 5
- Fig. 6
- Fig. 6
- Fig. 6
- Fig. 6
- Fig. 6
- Fig. 6
- Fig. 6
- Fig. 6
- Fig. 6
- Fig. 6
- Fig. 6
- Fig. 6
- Fig. 6
- Fig. 6
- Fig. 6
- Fig. 6
- Fig. 6
- Fig. 6
- Fig. 6
- Fig. 6
- Fig. 6
- Fig. 6
- Fig. 6
- Fig. 6
- Fig. 6
- Fig. 6
- Fig. 6
- Fig. 6
- Fig. 6
- Fig. 6
- Fig. 6
- Fig. 6
- Fig. 6
- Fig. 6
- Fig. 6
- Fig. 6
- Fig. 6
- Fig. 6
- Fig. 6
- Fig. 6
- Fig. 6
- Fig. 6
- Fig. 6
- Fig. 6
- Fig. 6
- Fig. 6
- Fig. 6
- Fig. 6
- Fig. 6
- Fig. 6
- Fig. 6
- Fig. 6
- Fig. 6
- Fig. 6
- Fig. 6
- Fig. 6
- Fig. 6
- Fig. 6
- Fig. 6
- Fig. 6
- Fig. 6
- Fig. 6
- Fig. 6
- Fig. 6
- Fig. 6
- Fig. 6
- Fig. 6
- Fig. 6
- Fig. 6
- Fig. 6
- Fig. 6
- Fig. 6
- Fig. 6
- Fig. 6
- Fig. 6
- Fig. 6
- Fig. 6
- Fig. 6
- Fig. 6
- Fig. 6
- Fig. 6
- Fig. 6
- Fig. 6
- Fig. 6
- Fig. 6
- Fig. 6
- Fig. 6
- Fig. 6
- Fig. 6
- Fig. 6
- Fig. 6
- Fig. 6
- Fig. 6
- Fig. 6
- Fig. 7
- Fig. 7
- Fig. 7
- Fig. 7
- Fig. 7
- Fig. 7
- Fig. 7
- Fig. 7
- Fig. 7
- Fig. 7
- Fig. 7
- Fig. 7
- Fig. 7
- Fig. 7
- Fig. 7
- Fig. 7
- Fig. 7
- Fig. 7
- Fig. 7
- Fig. 7
- Fig. 7
- Fig. 7
- Fig. 7
- Fig. 7
- Fig. 7
- Fig. 7
- Fig. 7
- Fig. 7
- Fig. 7
- Fig. 7
- Fig. 7
- Fig. 7
- Fig. 7
- Fig. 7
- Fig. 7
- Fig. 7
- Fig. 7
- Fig. 7
- Fig. 7
- All Figure Page
- Back to All Figure Page
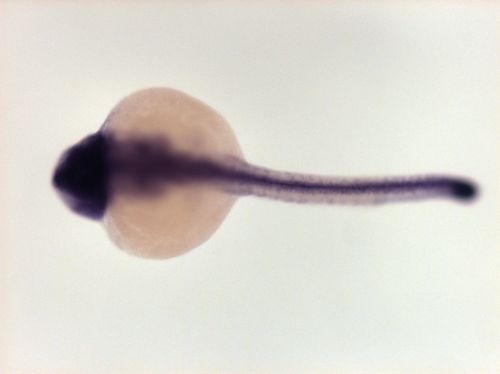
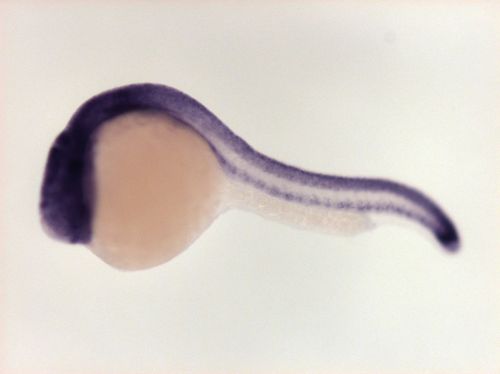
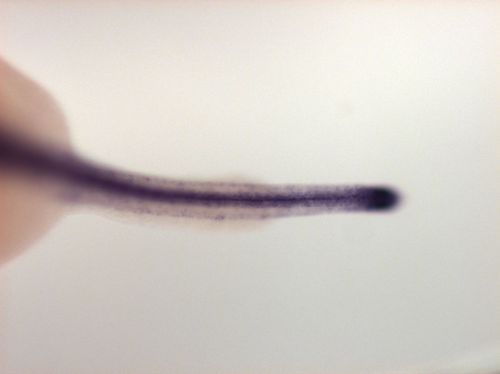
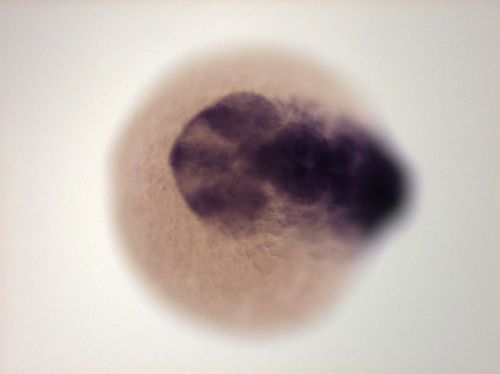
Fig. 4
|
CNS, stronger in posterior tegmentum, dorsal midline of mibrain and diencephalon 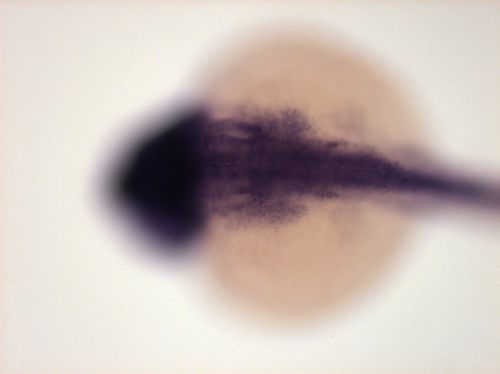
|
Expression Data
| Gene: | |
|---|---|
| Fish: | |
| Anatomical Terms: | |
| Stage Range: | 20-25 somites to Prim-5 |
| Probe: | cssl:d811 Quality: |
Expression Detail
Antibody Labeling
Phenotype Data
Phenotype Detail
Acknowledgments
This image is the copyrighted work of the attributed author or publisher, and
ZFIN has permission only to display this image to its users.
Additional permissions should be obtained from the applicable author or publisher of the image.