
Fig. 3
- ID
- ZDB-FIG-230204-12
- Publication
- Yang et al., 2021 - Novel loss-of-function variant in DENND5A impedes melanosomal cargo transport and predisposes to familial cutaneous melanoma
- Other Figures
- All Figure Page
- Back to All Figure Page
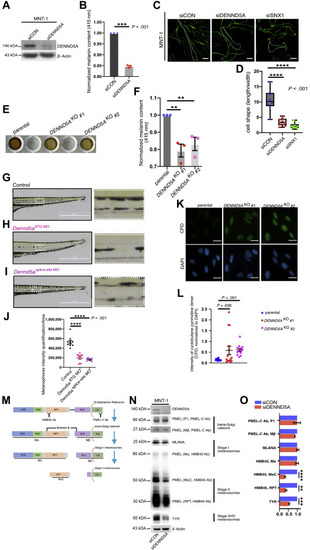
Figure 3. DENND5A inhibition leads to melanin reduction, morphological changes, and diminished PMEL. A. Representative western blotting image of DENND5A knockdown efficiency in MNT-1 cells. B. Melanin content of MNT-1 cells before and after knockdown of DENND5A, measured and normalized to corresponding protein yields. C. Phalloidin staining of control (siCON) MNT-1 cells and after silencing DENND5A or SNX1, as indicated. Scale bar: 20 μm D. Morphological changes quantified by dividing the length of each cell with its width. E. Melanin samples loaded in a 96-well plate showing the visible difference between MNT-1 parental cells and DENND5A gene knockout clones (#1, #2) established by CRISPR-Cas9 system. F. Quantification of relative melanin content of the parental and DENND5AKO 1 and 2. G-I. Brightfield images of (G) wild-type zebrafish (Danio Rerio), (H) Dennd5a knockdown (Dennd5aATG MO), and I Dennd5a-variant mimic (Dennd5asplice-site MO). Higher magnification images of the ventral medial stripes from each group are shown. Scale bar: 2 mm. J. The ventral medial stripes of zebrafish from each group quantified (10 zebrafish embryos per group) and compared. K. Representative images of the CPD staining in parental MNT-1 cells and its DENND5AKO 1 and 2 after UV exposures (30J/m2). Scale bar: 50 μm. L. The intensities of CPD in each area first quantified and normalized to the intensities of DAPI in the same area and then compared. M. Schematic chart of the processing of early-stage melanosomal cargo PMEL from the endoplasmic reticulum, trans-Golgi network, to stage I and stage II melanosomes. Ab PMEL-C recognizes the C-terminus of full-length PMEL precursor and the processed Mβ fragments, both of which are membrane-bound. Ab HMB45 recognizes the repeated domain of the full-length PMEL and detects the luminal fragments Mα and MαC, which are crucial for fibrillar matrix formation that is characteristic of stage II melanosomes. N. Western blotting and (O) quantification of melanosome markers from different stages of control (siCON) MNT1 and silencing DENND5A (siDENND5A). Quantification is performed from 3 independent experiments, (B, F, O) normalized to controls, and presented is as mean ± SEM. B., D., F., J., L., O. Two-tailed, unpaired t test. Ab, antibody; CPD, cyclobutane pyrimidine dimer; DAPI, 4′,6-diamidino-2-phenylindole. KLD, kringle-like domain; NTR, N-terminal region; PKD, polycystic kidney disease domain; RPT, Repeat domain. ∗P <.05; ∗∗P <.01; ∗∗∗P <.001; ∗∗∗∗P <.0001. |
| Fish: | |
|---|---|
| Knockdown Reagents: | |
| Observed In: | |
| Stage: | Day 5 |