
- Title
-
Novel loss-of-function variant in DENND5A impedes melanosomal cargo transport and predisposes to familial cutaneous melanoma
- Authors
- Yang, M., Johnsson, P., Bräutigam, L., Yang, X.R., Thrane, K., Gao, J., Tobin, N.P., Zhou, Y., Yu, R., Nagy, N., Engström, P.G., Tuominen, R., Eriksson, H., Lundeberg, J., Tucker, M.A., Goldstein, A.M., Egyhazi-Brage, S., Zhao, J., Cao, Y., Höiom, V.
- Source
- Full text @ Genet. Med.

Figure 1. Rare DENND5A variants identified in multicase melanoma families. A. Pedigrees of multicase melanoma families with heterozygous DENND5A variants. +/+ and +/– indicate the tested family members as DENND5A wild types and heterozygotes, respectively. B. A flowchart showing the variant filtering of exome sequencing applied to family A. C. Chromatograms of the validated DENND5A variants found in indicated families. The 1 base pair (bp) insertion (c.2903_2904insG) found in family A is shown on the left, and the 1 bp substitution (c.∗680C>T) found in family B is shown on the right in blue. D. Schematic diagram of the positions of identified variants in DENND5A mRNA (upper panel), and the predicted size of truncated protein (p.Ser969fs) derived from the frameshift variant. E. DENND5A amino acid alignments of a variety of species (human, mouse, rat, zebrafish, chimpanzee, goat, chicken, sheep) highlighting the conserved region flanking the frameshift area (shown in red). F. Representative western blotting and quantification (G) of DENND5A protein in EBV-lymphoblastoid cells established from 2 unrelated controls and DENND5A heterozygote individual (III:1) from family A. H. Correlation of cutaneous melanoma incidence rates, and the aggregated deleterious variants frequency in DENND5A, MC1R, MITF, CDKN2A, CDK4, and POT1 across the globe, including Southern Asian, Eastern Asian, African, Latino, Non-Finnish European, Finnish, and Swedish population. Two-tailed, (G) paired t test, (H) Pearson correlation. a.a., amino acid; CDS, coding sequence; EBV, Epstein-Barr virus; LoF, loss of function; MAF, minor allele frequency; mRNA, messenger RNA; NS, not significant; UTR, untranslated region. ∗P <.05; ∗∗P <.01. |

Figure 2. DENND5A is variably expressed in familial melanomas and enriched in pigmented melanoma tissue. A. Western blotting of DENND5A protein expression in tumors from familial melanomas from a Karolinska University Hospital–based registry since 2000. B. Quantification of relative DENND5A protein expression. Red dot represents DENND5A protein expression in melanoma (sample 355) derived from heterozygote individual (II:1). A dotted line is drawn across the DENND5A heterozygote sample as reference for potential DENND5A suppression. C. DENND5A mRNA expression in the skin cutaneous melanoma (SKCM) cohort of The Cancer Genome Atlas (TCGA) is classified into “normal-like” and “pigmentation” subtype by applying pigmentation gene signature and then compared. D-F. ST analysis on a CMM. D. Hematoxylin and Eosin stained CMM section (left) and higher magnification showing the pigmentation from the section (right). Scale bar: 1 cm (left), 0.25 cm (right). E. ST microarray on CMM section with barcoded spots of 100 mm diameter and 200 mm center-to-center distance. F. Density plot of DENND5A expression ran by trendsceek in the same section, with the regions of significantly elevated DENND5A expression marked red. G. Matrix of UV-related alterations (CC>TT in red; dpC>T, C>T transition at dipyrimidines, in pink) from all TCGA SKCMs, arising from both chronic (CSD) and nonchronic (non-CSD) sun-exposed body sites (n = 38). Sample types (primary or metastatic), body sites (CSD or non-CSD), and detected DENND5A somatic variants are color-coded and then sorted after DENND5A mRNA expression. H. Proportion of UV signature (CC>TT transitions) from DENND5AHigh (highest 15) and DENND5ALow (lowest 15) mRNA compared and shown as mean ± SEM. C., H. two-tailed, unpaired t test. CMM, cutaneous malignant melanoma; CSD, chronically sun damaged; ST, spatial transcriptomic. ∗P <.05; ∗∗∗P <.001. |
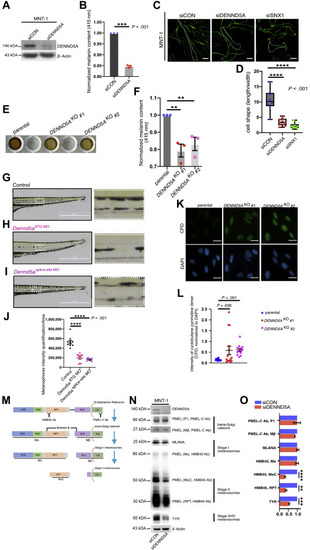
Figure 3. DENND5A inhibition leads to melanin reduction, morphological changes, and diminished PMEL. A. Representative western blotting image of DENND5A knockdown efficiency in MNT-1 cells. B. Melanin content of MNT-1 cells before and after knockdown of DENND5A, measured and normalized to corresponding protein yields. C. Phalloidin staining of control (siCON) MNT-1 cells and after silencing DENND5A or SNX1, as indicated. Scale bar: 20 μm D. Morphological changes quantified by dividing the length of each cell with its width. E. Melanin samples loaded in a 96-well plate showing the visible difference between MNT-1 parental cells and DENND5A gene knockout clones (#1, #2) established by CRISPR-Cas9 system. F. Quantification of relative melanin content of the parental and DENND5AKO 1 and 2. G-I. Brightfield images of (G) wild-type zebrafish (Danio Rerio), (H) Dennd5a knockdown (Dennd5aATG MO), and I Dennd5a-variant mimic (Dennd5asplice-site MO). Higher magnification images of the ventral medial stripes from each group are shown. Scale bar: 2 mm. J. The ventral medial stripes of zebrafish from each group quantified (10 zebrafish embryos per group) and compared. K. Representative images of the CPD staining in parental MNT-1 cells and its DENND5AKO 1 and 2 after UV exposures (30J/m2). Scale bar: 50 μm. L. The intensities of CPD in each area first quantified and normalized to the intensities of DAPI in the same area and then compared. M. Schematic chart of the processing of early-stage melanosomal cargo PMEL from the endoplasmic reticulum, trans-Golgi network, to stage I and stage II melanosomes. Ab PMEL-C recognizes the C-terminus of full-length PMEL precursor and the processed Mβ fragments, both of which are membrane-bound. Ab HMB45 recognizes the repeated domain of the full-length PMEL and detects the luminal fragments Mα and MαC, which are crucial for fibrillar matrix formation that is characteristic of stage II melanosomes. N. Western blotting and (O) quantification of melanosome markers from different stages of control (siCON) MNT1 and silencing DENND5A (siDENND5A). Quantification is performed from 3 independent experiments, (B, F, O) normalized to controls, and presented is as mean ± SEM. B., D., F., J., L., O. Two-tailed, unpaired t test. Ab, antibody; CPD, cyclobutane pyrimidine dimer; DAPI, 4′,6-diamidino-2-phenylindole. KLD, kringle-like domain; NTR, N-terminal region; PKD, polycystic kidney disease domain; RPT, Repeat domain. ∗P <.05; ∗∗P <.01; ∗∗∗P <.001; ∗∗∗∗P <.0001. PHENOTYPE:
|
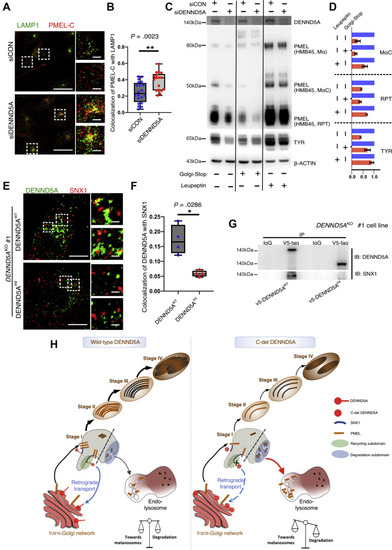
Figure 4. Defective DENND5A triggers lysosomal degradation of melanosomal cargoes and fails to associate with SNX1-decorated vesicles. A. Representative confocal microscopy images of control MNT-1 (siCON, upper) and after silencing DENND5A (siDENND5A, lower). LAMP1 (green) and PMEL (PMEL-C antibody, red) labeled MNT-1 cells are labeled and shown in merged channels, with higher magnification on the right-hand side. Scale bars: 10 μm, 1 μm for the magnified panels. B. Colocalization measured using images from 2 independent experiments. C. Western blotting and (D) quantification of melanosome markers for control (siCON) treated MNT-1 and siDENND5A treated MNT-1 cells after treatment of Golgi-stop and lysosome protease inhibitor leupeptin, respectively. E. DENND5AKO 1 MNT-1 cells transiently introduced with V5-DENND5AWT (upper) and V5-DENND5Amt (lower). Transfected cells stained for DENND5A (green) and SNX1 (red). Scale bars: 10 μm, 1 μm for the magnified panels. F. Colocalization coefficiency measured using images from 2 independent experiments. Data quantification is presented as mean ± SEM. D. Two-tailed, Unpaired t test. B., F. Mann-Whitney test. G. Immunoprecipitation of V5-tag in DENND5 KO 1 cells overexpressing the wild-type (V5-DENND5AWT) and truncated (V5-DENND5Amt) constructs. H. Proposed working model showing the homeostasis of melanosome maturation and lysosomal degradation coordinated by DENND5A-SNX1 interaction (left). C-del DENND5A loses its interaction with SNX1 and triggers missorting of PMEL from en route to melanosomes to degradation subdomain (stage I melanosome),26 resulting in lysosomal entry and degradation of PMEL (right). IB, immunoblotting; IP, immunoprecipitation; RPT, repeat domain. ∗P <.05; ∗∗P <.01. |