FIGURE

Figure 6

ID
ZDB-FIG-210714-47
Publication
Jamalpoor et al., 2021 - Cysteamine-bicalutamide combination therapy corrects proximal tubule phenotype in cystinosis
Other Figures
All Figure Page
Back to All Figure Page
Figure 6

Cysteamine–bicalutamide combination treatment is effective in patient‐derived cystinotic tubuloids and cystinotic zebrafish

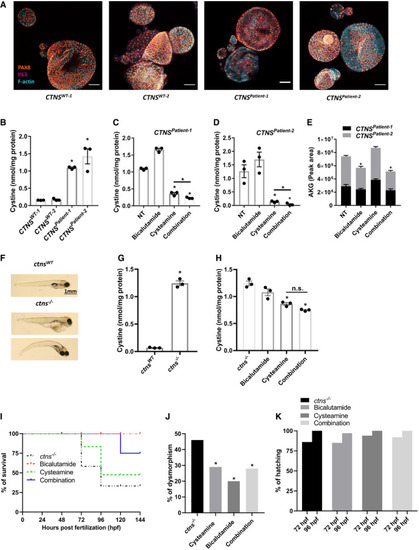
Immunocytochemistry of patient‐derived cystinotic tubuloids (CNTSPatient‐1 and CTNSPatient‐2) and healthy kidney tissue‐derived control tubuloids (CNTSWT‐1 and CTNSWT‐2) for PAX8, TP63 and F‐actin. Scale bar = 100 µm.

Quantification of cystine levels (nmol/mg protein) by HPLC‐MS/MS in control and cystinotic tubuloids (n = 3).

Quantification of cystine levels (nmol/mg protein) by HPLC‐MS/MS in two different patient‐derived cystinotic tubuloids in the absence of the drugs (NT) or upon treatment with cysteamine (100 μM), bicalutamide (35 μM) or cysteamine (100 μM)‐bicalutamide (35 μM) combination treatment (n = 3).

αKG levels measured in patient‐derived cystinotic tubuloids (CNTSPatient‐1 and CTNSPatient‐2) in the absence of the drugs (NT) or upon treatment with cysteamine, bicalutamide or cysteamine–bicalutamide combination treatment using metabolomics (n = 3).

Representative images of control and cystinotic zebrafish.

Quantification of cystine levels (nmol/mg protein) by HPLC‐MS/MS in control and cystinotic zebrafish (n = 3).

Quantification of cystine levels (nmol/mg protein) by HPLC‐MS/MS in cystinotic zebrafish after treatment with cysteamine (1,000 µM), bicalutamide (10 µM), and a combination of cysteamine and bicalutamide (1,000 and 10 µM, respectively) (n = 40 embryos per group).

Survival rates in ctns−/− zebrafish upon treatment with cysteamine, bicalutamide, and a combination of cysteamine and bicalutamide (n = 40 embryos per group).

Deformity rates in ctns−/− zebrafish after treatment with cysteamine, bicalutamide, and a combination of cysteamine and bicalutamide (n = 40 embryos per group).

Hatching rates in surviving ctns−/− zebrafish evaluated at 72‐ and 96‐h post‐fertilization (hpf) with cysteamine, bicalutamide, and a combination of cysteamine and bicalutamide (n = 40 embryos per group).

Data information: Data are expressed as mean ± SEM. *P‐values < 0.05 were considered to be significant. One‐way ANOVA with Dunnett’s correction (B, C, D, E, G, H and J) or unpaired t‐test (C, D and H). Exact P‐values and statistical tests are listed in Appendix Table S1.

Expression Data

Expression Detail
Antibody Labeling
Phenotype Data
Fish:
Condition:
Observed In:
Stage Range: Long-pec to Day 6

Phenotype Detail
Acknowledgments
This image is the copyrighted work of the attributed author or publisher, and ZFIN has permission only to display this image to its users. Additional permissions should be obtained from the applicable author or publisher of the image. Full text @ EMBO Mol. Med.