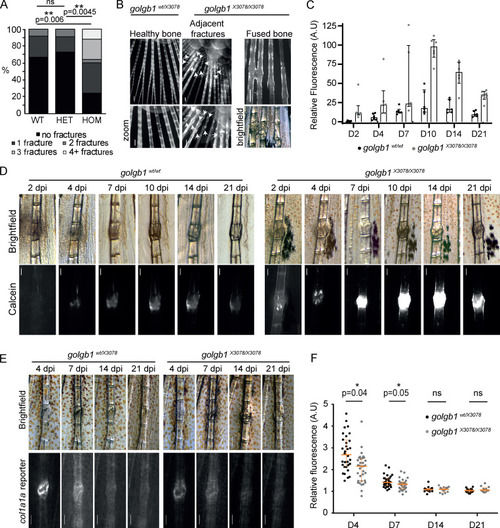
Fracture defects in golgb1 mutant zebrafish. (A) Quantification of the number of fractures naturally found in the caudal fin of WT and golgb1X3078/X3078 heterozygous and HOM mutant fish at 7 mo old. Data show percentage of fish with × number of fractures (WT = 12 fish, HET = 11 fish, HOM = 25 fish from two independent crosses). Statistics performed with a Mann-Whitney U test. (B) Fluorescence images of naturally occurring caudal fin defects in golgb1X3078/X3078 fish stained with ARS. White arrows indicate fractures. Scale bar = 200 µm. (C and D) Quantification (C) and representative brightfield and fluorescent images (D) of experimentally induced fractures in golgb1wt/wt and golgb1X3078/X3078 caudal fins on different dpi. Bone was stained with calcein at each time point before imaging. (C) Calcein intensity in fractures was measured relative to that of healthy adjacent bones. Lower exposure images than those in D were used for quantification to avoid saturation. Each dot represents one fracture. Bars show median and interquartile range (two fish per line quantified, each with three fractures). (D) Proximal end of bone is at the top of image. Scale bar = 200 µm. (E) Representative brightfield and fluorescent images of experimentally induced fractures in the caudal fin of golgb1wt/X3078 and golgb1X3078/X3078 fish expressing a col1a1a:GFP promoter reporter at different time points. Proximal end of bone is at the top of image. Scale bar = 200 µm. (F) Quantification of col1a1a:GFP signal at the fracture site relative to an adjacent healthy bone. Each dot represents one fracture. Orange bars indicate median and interquartile range. At time points 4 and 7 dpf, 11 fish per line were quantified. At time points 14 and 21 dpf, n = 6 HETs and n = 4 HOM fish quantified. All data were collected in a single experiment. All P values were calculated with the Mann-Whitney U test comparing the means for each fish, three fractures per fish. A.U, arbitrary units.
|
