
FIGURE
Fig. 3
- ID
- ZDB-FIG-170523-6
- Publication
- Anuppalle et al., 2017 - Expression patterns of prune2 is regulated by Notch and retinoic acid signaling pathways in the zebrafish embryogenesis
- Other Figures
- All Figure Page
- Back to All Figure Page
Fig. 3
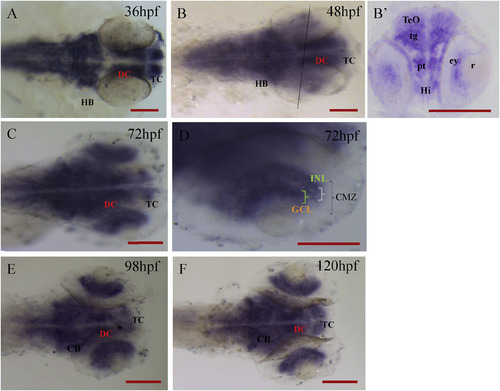
Distribution of prune2 transcripts in the early larval development.prune2 messages were restricted to the CNS at 36 hpf through 120 hpf. A-C, E, F; dorsal view. D; magnified retina of the embryo at 72 hpf in panel C. CMZ; Ciliary Marginal Zone, GCL; Ganglion Cell Layer, INL; Inner nuclear Layer, TC; telencephalon, DC; diencephalon, HB; hind brain, CB; cerebellum. All scale bars in red indicate 50 μm. B′ is the transverse section along the black line of panel B. |
Expression Data
| Gene: | |
|---|---|
| Fish: | |
| Anatomical Terms: | |
| Stage Range: | Prim-25 to Day 5 |
Expression Detail
Antibody Labeling
Phenotype Data
Phenotype Detail
Acknowledgments
This image is the copyrighted work of the attributed author or publisher, and
ZFIN has permission only to display this image to its users.
Additional permissions should be obtained from the applicable author or publisher of the image.
Reprinted from Gene expression patterns : GEP, 23-24, Anuppalle, M., Maddirevula, S., Kumar, A., Huh, T.L., Choe, J., Rhee, M., Expression patterns of prune2 is regulated by Notch and retinoic acid signaling pathways in the zebrafish embryogenesis, 45-51, Copyright (2017) with permission from Elsevier. Full text @ Gene Expr. Patterns